https://doi.org/10.36253/bsgi-7516
Slow Mobility and Big Data: Exploring the Nexus Between Urban Mobility and Heritage Through GeoAI
Mobilità lenta e Big Data: un’analisi delle connessioni tra mobilità urbana e heritage attraverso la GeoAI
Department of Civilisations and Forms of Knowledge, University of Pisa, Italy
Email: michela.lazzeroni@unipi.it; antonello.romano@unipi.it; paola.zamperlin@unipi.it
Abstract. Starting from the new mobility paradigm (Sheller, Urry, 2006), this work explores the use of spatial big data in the field of urban mobility and their connection with cultural and natural heritage at the local scale. The focus is on the nexus between slow mobility and heritage in Pisa (Italy) at the intra-urban scale, employing GeoAI and big data analysis techniques. First, through the analysis of 151,110 GPS tracks of pedestrian trips recorded by the Strava Metro platform over a period of one year (2022) in the province of Pisa, we describe the most popular locations for slow mobility, and we predict the areas where people tend to linger. Second, we study in depth the case of the municipality of Pisa to critically discuss: a) the influence of heritage on mobility spatial trends, b) the link between slow mobility and urban heritage fruition; c) the contribution of big data and GeoAI models to analyze this nexus. The observation of these patterns is helpful in terms of policies: i) for the identification of the most used corridors and alternative solutions for wider access to urban heritage, which also includes “minor” sites; ii) for the development of spatial models to highlight walking routes in near real-time and encourage slow mobility practices.
Keywords: slow mobility, heritage, big data, GeoAI, Strava.
Riassunto. Partendo dal nuovo paradigma della mobilità (Sheller, Urry, 2006), questo lavoro esplora l’uso dei big data spaziali relativi alla mobilità urbana e il loro legame con l’heritage su scala locale. L’obiettivo è indagare, alla scala (intra)urbana, il nesso tra mobilità lenta e heritage nella città di Pisa, impiegando tecniche di GeoAI. In primo luogo, attraverso l’analisi di 151.110 tracce GPS registrate dagli utenti della piattaforma Strava nell’arco di un anno (2022) all’interno della provincia di Pisa, il lavoro evidenzia le aree più interessate dalla mobilità lenta e prevede i percorsi più utilizzati. In secondo luogo, si analizza in dettaglio il caso studio del comune di Pisa per discutere criticamente: a) l’influenza del patrimonio sulle dinamiche spaziali della mobilità; b) il legame tra mobilità lenta e fruizione dell’heritage urbano; c) il contributo dei big data e dei modelli di GeoAI nell’analisi di questo rapporto. Inoltre, l’osservazione di tali pattern di mobilità risulta utile in termini di policy per: i) l’identificazione dei corridoi più utilizzati e la possibilità di proporre soluzioni alternative per un accesso più ampio all’heritage urbano, includendo anche i siti “minori”; ii) lo sviluppo di modelli spaziali per monitorare i percorsi pedonali in tempo reale e incentivare pratiche di mobilità lenta per una migliore esperienza dell’heritage.
Parole chiave: mobilità lenta, heritage, big data, GeoAI, Strava.
Contents
1. Introduction
Understanding how people move through the spaces they inhabit has always fascinated geography and mobility studies scholars. Whether related to commuting, migratory movements, or tourism, mobility has become a factor that increases the complexity of the contemporary world (Sheller, Urry 2006; Cresswell 2006). The academic debate has addressed various types of mobility, considering differences in scale, contextual characteristics, the categories of people on the move, and the objectives driving their movements (Bissell 2020). In recent years, significant attention has been devoted to slow mobility and its potential to enhance the experience of place and its cultural and natural heritage (Maltese et al. 2017) in both urban environments and peri-urban and rural routes.
In this context, we explore the relationship between slow mobility and heritage at the intra-urban scale using spatial big data and the experimentation of a GeoAI methodology, with a focus on the city of Pisa. The primary objective is to understand how slow mobility practices can influence and are influenced by the spatial distribution of cultural and natural heritage. The literature on this topic highlights how mobility flows are often shaped by both personal and contextual factors (Chapin 1974; 1978; Daniels, Warners 1980; Hui 2013; Greene, Rau 2018), delineating a complex interaction between individuals and the places they traverse. Similarly, slow mobility, particularly walkability, has been studied both as a physical attribute of the urban environment and as a perceived outcome of sustainable mobility practices (Forsyth 2015; Annunziata, Garau 2020). However, the connection between slow mobility and heritage fruition remains a relatively unexplored area, especially through big data-driven approaches. We have tried to provide a contribution with regard to: a) the influence of heritage on spatial mobility trends; b) the link between walkability, slow mobility, and urban heritage fruition; c) the role of big data and GeoAI to better understand this nexus and to build predictive models.
To achieve these objectives, this work employs a dataset of 151,110 GPS tracks provided by the Strava Metro platform, a service offered by Strava, a popular fitness tracking app that aggregates and anonymizes data collected from users’ activities, such as walking, running, and cycling. Unlike individual Strava data tied to specific users, Strava Metro focuses on the collective data of millions of users worldwide, making it highly relevant for urban planning, transportation analysis, and infrastructure development. The dataset analyzed refers to the year 2022 and includes “pedestrian” traces from 20,100 Strava users in the province of Pisa, an area characterized by a cultural and natural heritage stratified over time and a variety of city users (in addition to residents, tourists, commuters, and students). The case study analysis allows the reconstruction of patterns and routes of slow mobility at the intra-urban level and the identification of strengths and potential criticalities in heritage accessibility. Furthermore, it tests the analysis methodology based on spatial big data and GeoAI, with a view to its applicability in monitoring activities for urban planning and its replicability in other urban contexts.
About the structure of the paper, section 2 presents the theoretical framework, reviewing key studies on mobility while introducing slow mobility and place-based experiences. Section 3 outlines the methodology integrating Strava Metro data within a GeoAI framework. Section 4 synthesizes the main findings of the case study at the intra-urban scale, while Section 5 discusses the results, highlighting the key implications, potential applications, and critical challenges.
2. Theoretical Framework
The literature on mobility is rich in discussions on the complex interactions that people have with the places they traverse and on the reasons for the choice of movements among different types of city users (Martinotti 1993; 1999; Morri 2003; Nuvolati 2007; Hui 2013; Greene, Rau 2018; Shields et al. 2021). According to the literature of Chapin (1974; 1978), urban movements are classified in accordance with their different scopes, distinguishing between those related to work activities and those connected to recreational habits, highlighting that the choice was essentially conditioned by two main explanatory coordinates, which he called propensity and opportunity. The former refers to personal motivations and existing preconditions, while the latter is influenced by the perception of the qualities and accessibility of the necessary service spaces, thus relying on a map of places and spaces derived both from personal knowledge and direct experiences. Later, he added two more components: situation, which can be understood as the temporal and situational appropriateness of actions, and urban environmental context, which encompasses the non-psychological constraints of human action. Daniels and Warners (1980) highlight different categories within which to group the factors that explain different movement trajectories to and from a specific place, and reflect on the coexistence of push factors, from the individual to the destination, and pull factors, related to the places, emphasizing the inseparability of this dynamic of dense and mutual relations between the subject and places.
The various mobility practices establish different relationships of identification with space. The increasing mobility of people, which tends toward expanding distances and shortening travel times, tends to make the relationships that individuals have with places more tenuous and fragmented. Understanding the daily flow of constant and occasional or periodic presences is important in the analysis of morphological and functional transformations of contemporary cities. In areas where population exchange is continuous, as in the case of this study, and where trajectories of different nature and magnitude are interwoven, there is also a need to understand the link between these, and the places lived. Unfortunately, there is often a structural lack of descriptive data useful for deeply framing the phenomenon, in terms of quality and timely updates. These shortcomings hinder the ability to formulate effective responses for managing the complex dynamics of user attendance, integration, and exclusion within the urban context. Furthermore, as known from previous studies (Nuvolati 2007; Greene, Rau 2018), most people move by combining multiple purposes and directions, sometimes with a zigzag pattern involving pre-established and unexpected destinations. Therefore, by outlining the typology of users, it is possible to investigate the type of mobility in terms of route preferences, times, frequencies, etc., and how these preferences intersect with the opportunities offered by the urban and peri-urban fabric, as well as which relationships are intertwined with the heritage (Nikielska-Sekuła, Banaszkiewicz 2025).
In this work, we focus on slow mobility, undertaken for recreational and health purposes to capture significant aspects within the multitude of roles, identification processes, and diverse territorial usage practices in their matrices of origin and destination as well as the possible temporal strategies adopted according to needs, habits, and lifestyles that each individual implements concerning the surrounding environment. We aim to verify two assumptions. The first one posits that the beauty of the heritage can potentially influence mobility choices, especially the one under consideration here, namely slow mobility for recreational purposes. The second one asserts that the mobility paths that consolidate and become shared can impact on the heritage experience. Building upon these assumptions, the city and its surroundings are here considered based on their walkability properties, their ability to manage transit, and their propensity to facilitate the use of their spaces, particularly places with a high heritage component, to understand whether and how slow mobility could enhance the enjoyment of the cultural and natural heritage. In this sense, slow mobility, as a set of practices that exploit space, also takes on the meaning of performative practice (Harvey 2024). As city users reclaim spaces, urban trajectories are reconfigured. Along with them, the interaction with the surrounding territory takes on its own characteristics, shaping the sense of place identity and impacting aspects such as safety, real or perceived, the need for urban furnishings, lighting, signage, etc., which have implications for urban planning.
A certain part of the research focusing on slow mobility and cities has concentrated on evaluating the walkability of urban environments, or more broadly, anthropized environments, starting from the basic consideration that walking is an important sustainable transport mode, if not necessary, in urban areas (Forsyth 2015; Knapskoga et al. 2019). Therefore, if the existing literature correlates walkability to attributes of both the social and physical environment (Annunziata, Garau 2020), we try to understand which characteristics of the physical and social environment influence the choices of the slow mobility that we are examining, specifically concerning heritage. In this sense, walkability indices typically consider components of urban morphology and “characteristics of the built environment and land use may or may not be conducive to residents in the area walking for either leisure, exercise, or recreation” etc. (Leslie et al. 2007). However, they rarely parameterize the attractive factors that are inherent to the landscape or identity value of places for the diverse communities that inhabit them. Studies attempting to measure the subjective qualities of the urban environment are rare, primarily in urban design, and always with the aim of providing operational indications aimed at improving the road environment. Among them, Singh’s work (2016) attempts to objectively measure the qualities of the walking environment as subjectively perceived, establishing an interesting relationship between the perception of the environment, the physical characteristics of the built environment, and walking behavior. Equally noteworthy is the work of Rolando and Scandiffio (2022), in which a certain type of sustainable multimodal mobility is analyzed in relation to the spatial distribution of heritage and its attractiveness based on two main criteria: heritage density and heritage diversity.
Compared to the above-mentioned and other studies, the aspect that we consider most innovative in this research is the adoption of a data-driven approach based on a dataset generated by users of the Strava application, which has been growing in richness over the past few years and will be extensively described in the following paragraphs. On the one hand, this has allowed us access to a volume of georeferenced data unthinkable until a few years ago, with characteristics that provide not only purely quantitative indications of the phenomenon but also qualitative insights that can be inferred from the analysis of user behaviors (Balletto et al. 2019). The available data constitutes a valuable resource to extract information on routes and the most common practices of users with explicit gender, age, and implicit habits characteristics. On the other hand, the georeferenced data can be analyzed by combining it with other territorially coherent databases. Therefore, the analysis aims to understand how this subset of city users interacts with the urban and peri-urban space, even in its dimension as a cultural and environmental asset.
Within the culture of contemporary participation, the sharing of georeferenced information, from simple and punctual forms to more articulated and dynamic ones such as itineraries, contributes to generating a dual interpretative level of the relationship between individuals and space, which materializes in the real space but is inspired, designed, and defined at a virtual level. In a volume published just over a decade ago, the authors posed the problem of investigating the ways in which social media and digital technology reframe our understanding and experience of heritage by offering more participatory ways of interacting directly or indirectly with heritage objects (Giaccardi 2012). Since the slow mobility of walking is inherent to human beings, equally available and accessible are the digital technologies that accompany the act of walking today. Therefore, for the reading and interpretation of the nexus between slow mobility and heritage, both the above-mentioned levels must be considered: the purely physical and active one and the descriptive and informative one that partly derives from the former and contributes to its representation. In this sense, Van Der Zee et al. (2017) analyze cultural landscapes via digital traces left behind on Tripadvisor platforms to understand the spatial behavior of tourists and its relationship with the quality of heritage. Moreover, in the act of covering places on foot, whether walking or running, one moves through places in a temporal dimension of slowness that surreptitiously induces an interpenetration between the subject and the heritage, heightening the processes of recognizing the cultural signs scattered within it and possible identification with them. Daily practices, such as walking, cycling, running, or even contemplating, more easily allow for the recognition and emergence of even the most hidden and minor aspects of heritage scattered in ordinary landscapes (Visentin 2021).
These experiences show in concrete terms how slow mobility routes are in constant dialogue with the cultural and natural heritage. It could not be otherwise because naturally, in these practices of movement, routines are established that “create embedded links between people, place, and identity” (Harvey 2015).
3. Data and Methodology
The tracking of active forms of mobility, such as biking and walking, has historically depended on conventional methods like travel surveys and traffic monitoring. However, with the widespread use of mobile devices (like smartphones) and the advent of the big data era, the collection of data on active travel is no longer confined to traditional approaches (Lee et al. 2016).
According to Kitchin (2014, 3),
the hype and hope of big data is a transformation in the knowledge and governance of cities through the creation of a data deluge that seeks to provide much more sophisticated, wider-scale, finer-grained, real-time understanding, and control of urbanity. Big data indeed is characterized by its substantial volume, dynamism, heterogeneity, granularity, interconnectedness, and cost-efficiency, which collectively facilitate a paradigm shift in research methodologies.
This paradigm encompasses a transition from a data-scarce environment to one that is abundantly data-rich, enabling researchers to move beyond static representations to capture the dynamic evolution of phenomena. This evolution in data availability and analytical capabilities supports the advancement from relatively simplistic hypotheses and models to the development and application of more intricate, nuanced simulations and theoretical frameworks. Consequently, big data offers the potential for a sophisticated understanding of complex systems and phenomena.
Within this context, the spread of Artificial Intelligence (AI) and generative models marked a further revolution, reshaping both conceptual understanding and methodological perspectives. In more detail, Geospatial Artificial Intelligence (GeoAI) can be defined as a multidisciplinary field that combines the principles and techniques of AI, including machine learning and deep learning, with geospatial sciences and big data. While not a recent innovation – deep learning models have been utilized in various geographical domains for years (Liu, Biljecki 2022) – the field has seen notable growth since the introduction and advancement in generative AI tools like ChatGPT in November 2022. On the potential side, according to Mortaheb and Jankowski (2023), GeoAI is useful in explaining phenomena that occur in our society, extracting valuable insights from geospatial data, and supporting more informed decision-making (Mortaheb, Jankowski 2023). On the contrary, its expansion also poses unique methodological challenges, such as data input, scale, the Modifiable Areal Unit Problem (MAUP), and interpretability issues (Liu, Biljecki 2022). Furthermore, such widespread use could impact the privacy of individuals and require careful consideration of ethical and equitable issues.
While this work does not delve deeply into these broader implications, its focus is on exploring the relationship between slow mobility and heritage in Pisa by employing a blend of spatial big data and GeoAI. Spatial big data can be defined as georeferenced data that are associated with specific spatial coordinates; highly granular, detailed, and often collected in real-time; and endowed with a geographic perspective, essential for analyzing spatial patterns and dynamics (Jiang, Shekhar 2017; Leszczynski, Crampton 2016). As introduced, mobility and walkability give value to certain spaces; at the same time, certain spaces with their heritage convey selective mobility. The spatial data that we produce through different devices can reveal a lot about this relationship. In particular, the data we analyzed comes from Strava Metro, a service provided by Strava, a popular fitness tracking app, that aggregates and anonymizes data collected from users’ activities, such as running and cycling, to provide insights into transportation patterns and mobility trends. Unlike individual Strava data, which is tied to specific users, Strava Metro focuses on collective data from millions of users around the world, making it useful for urban planning, transportation analysis, and infrastructure development. The Strava app, launched in 2009, records more than 4 billion activities (cycling, walking, hiking, and swimming) worldwide shared by 100 million registered users worldwide. Users can also upload their GPS-tracked activities to the platform that functions as a social media space where Strava users share their cycling, running, walking, and hiking experiences. According to the platform itself, “the Strava dataset is the largest collection of information on human-powered transportation in the world” whose traces can be instrumental for urban mobility planning (Romano 2022). The peculiarity of this platform is that among various tracking apps running on GNSS-enabled devices, Strava has continuously collected human movement records since 2009 (Lee, Sener 2021).
Several studies have indeed used Strava data on biking to analyze the patterns preferred by cyclists (Huber, Lißner 2019), to evaluate the quality of the cycling infrastructure (Heesch et al., 2016). Recent research has explored the use of such data to analyze various aspects of urban transportation, recreational activities, and environmental factors. Venter et al. (2023) examined the bias and precision of crowdsourced recreational activity data from Strava, highlighting its potential and limitations for spatial and urban analysis. Lee and Sener (2021) provided a comprehensive review of Strava Metro data, emphasizing its role in monitoring bicycle traffic and its growing importance in transportation research. Similarly, Sun and Mobasheri (2017) utilized Strava data to study air pollution exposure during cycling, demonstrating the potential of crowdsourced data for environmental health studies. Hochmair et al. (2019) applied Strava tracking data to estimate bicycle trip volumes in Miami-Dade County, showing how such data can support transportation planning and infrastructure development. Such studies underscore the value of these data for understanding urban mobility patterns, environmental impacts, and recreational behaviors, while also pointing to the challenges and opportunities in using more generally crowdsourced geographic information for spatial analysis and decision-making. In this sense, the study by Horst et al. (2023) concludes that GNSS-based Volunteered Geographic Information (VGI) offers a promising opportunity for real-time monitoring of visitor patterns. However, it also highlights some challenges, such as variability in data quality due to factors like GPS accuracy and positional recording errors.
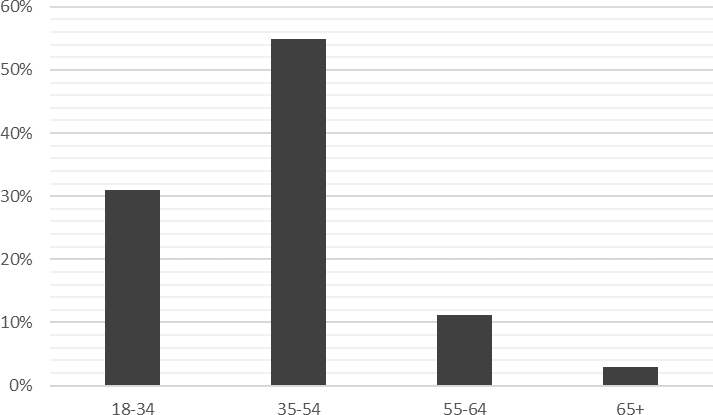
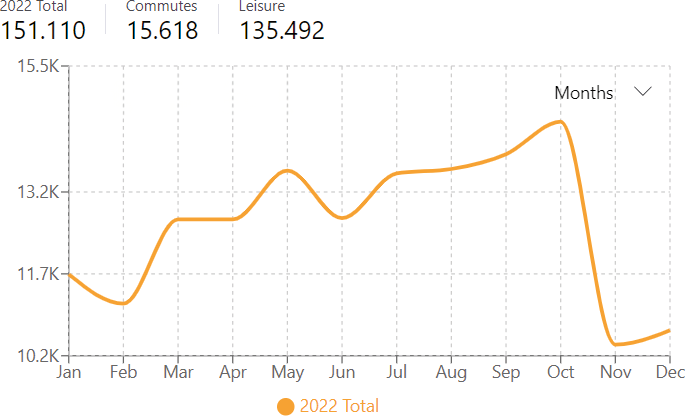
Taking into consideration these aspects, the methodology is structured into four phases. Firstly, we downloaded and analyzed from Strava Metro platform 151,110 spatial tracks recorded over a year from Strava users in the Province of Pisa. In more detail, such a dataset includes: 101,801 running trips (67.4%), 44,899 walking trips (29.7%), and 4,410 hiking trips (2.9%), contributed by 20,100 individuals, most of them in the 35-54 age group (Fig. 1). As the data shows, seasonal and daytime variations can be monitored as well (Fan, Lin 2019); in our dataset, the peak of trips is recorded in October, while decreases in the winter season (Fig. 2). Most trips are connected to leisure (90%), presumably linked to tourist flows and sports mobility (running and walking), while only 10% is connected to commuting. Furthermore, 49,800 trips (33%) occurred during weekends.
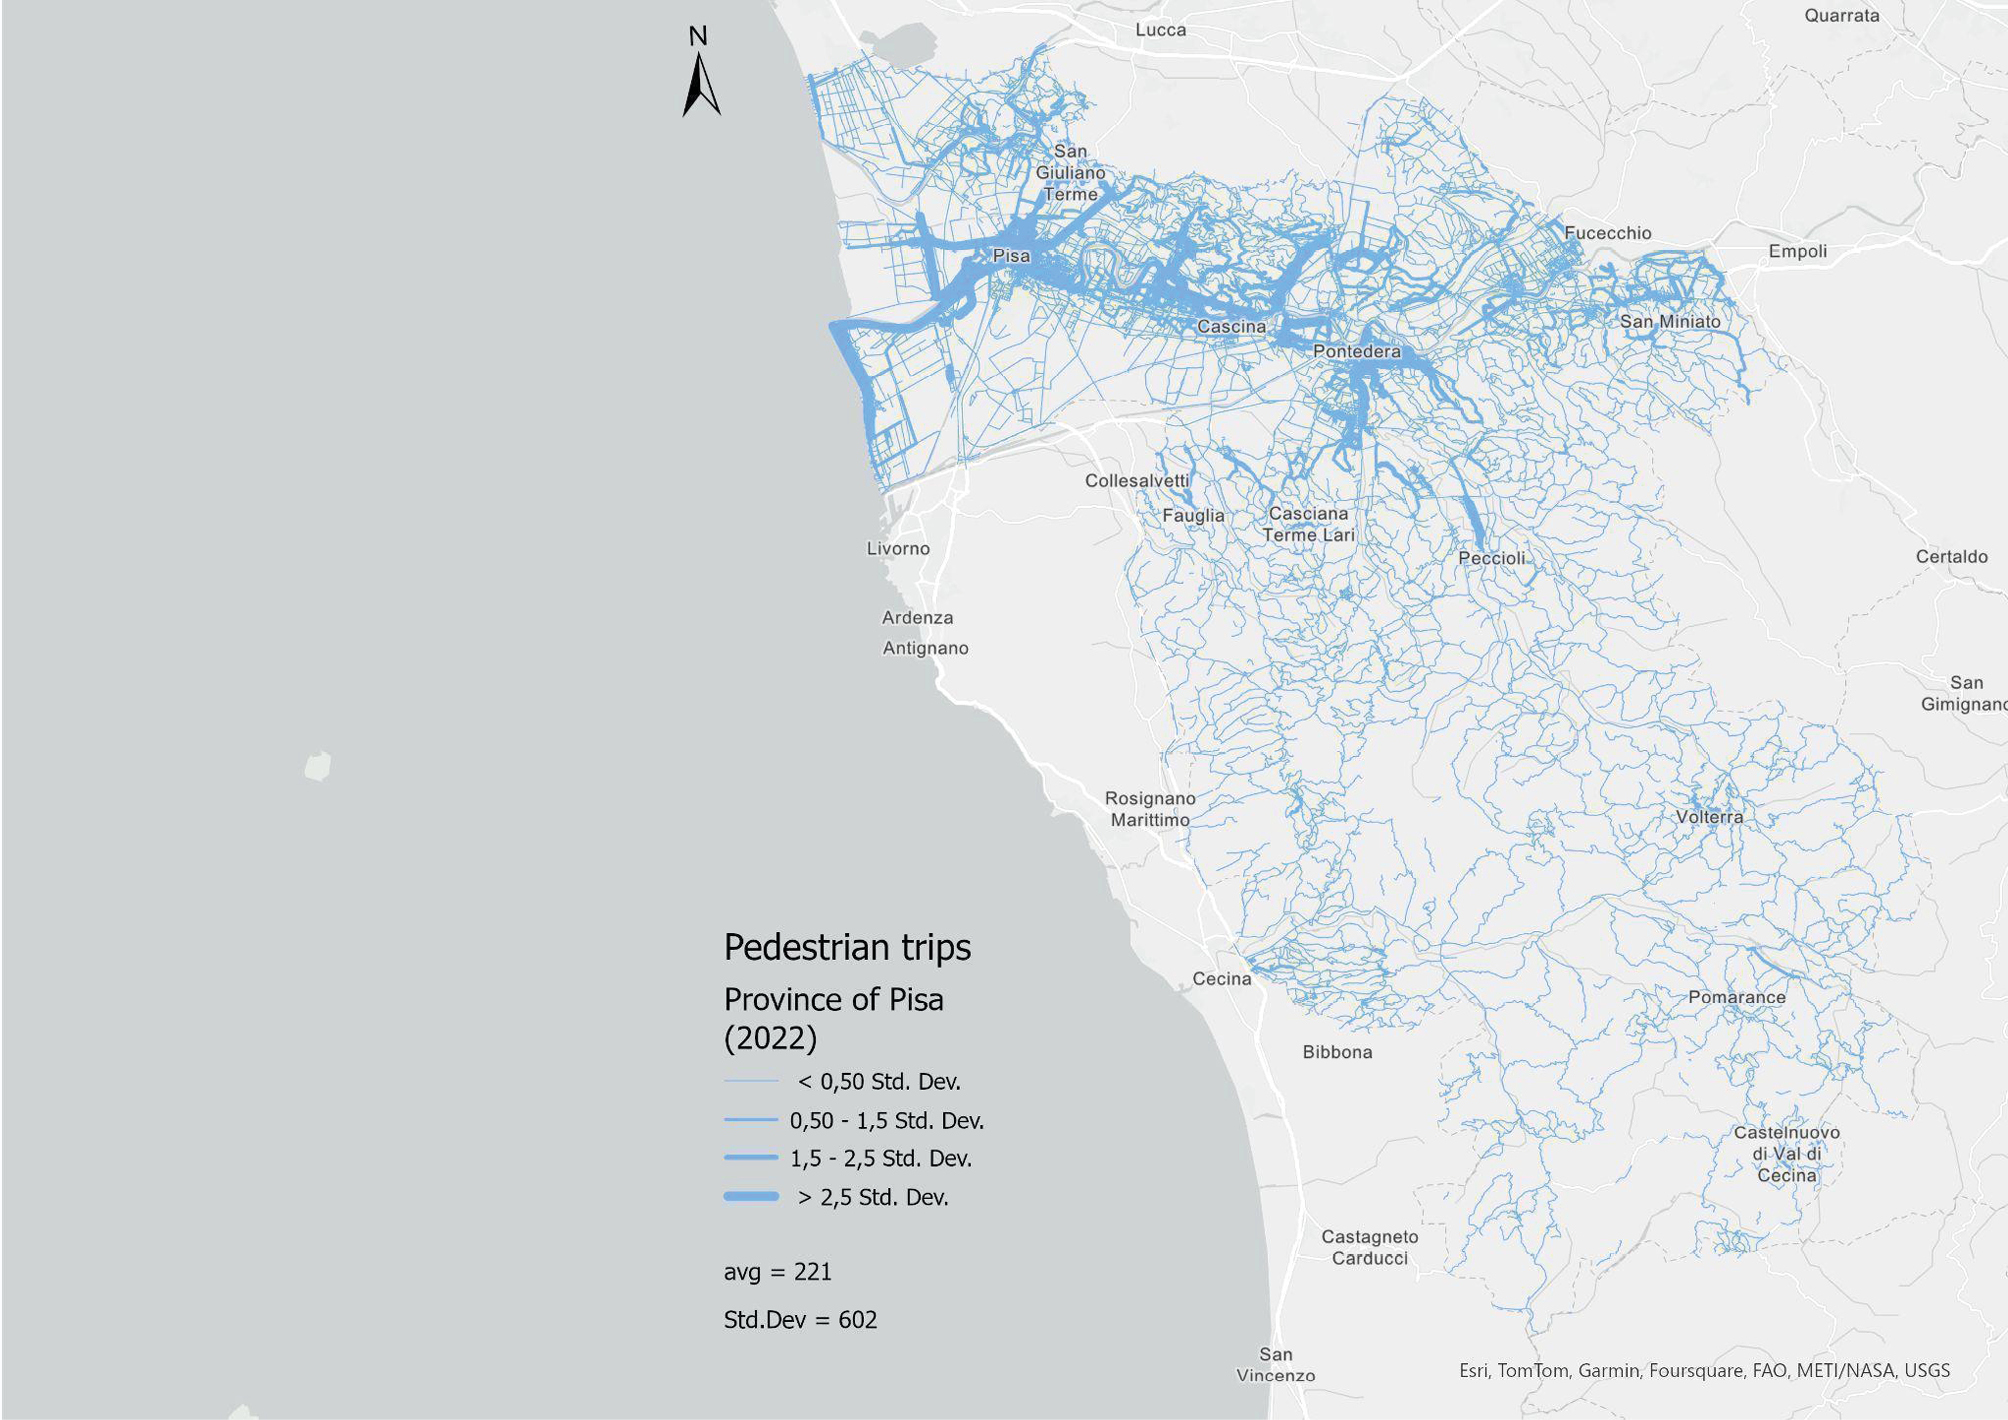
Second, we mapped the data (Fig. 3) at the province level to have a general view of the spatial distribution of the pedestrian trips. As we can see, the map illustrates the presence of strong mobility patterns such as the Pisa-Cascina-San Giuliano axis is highlighted; as the Pontedera town and surrounding areas; the Pisa-Calambrone seacoast; at the same time weaker internal patterns but with interesting ramifications in hilly areas emerges.
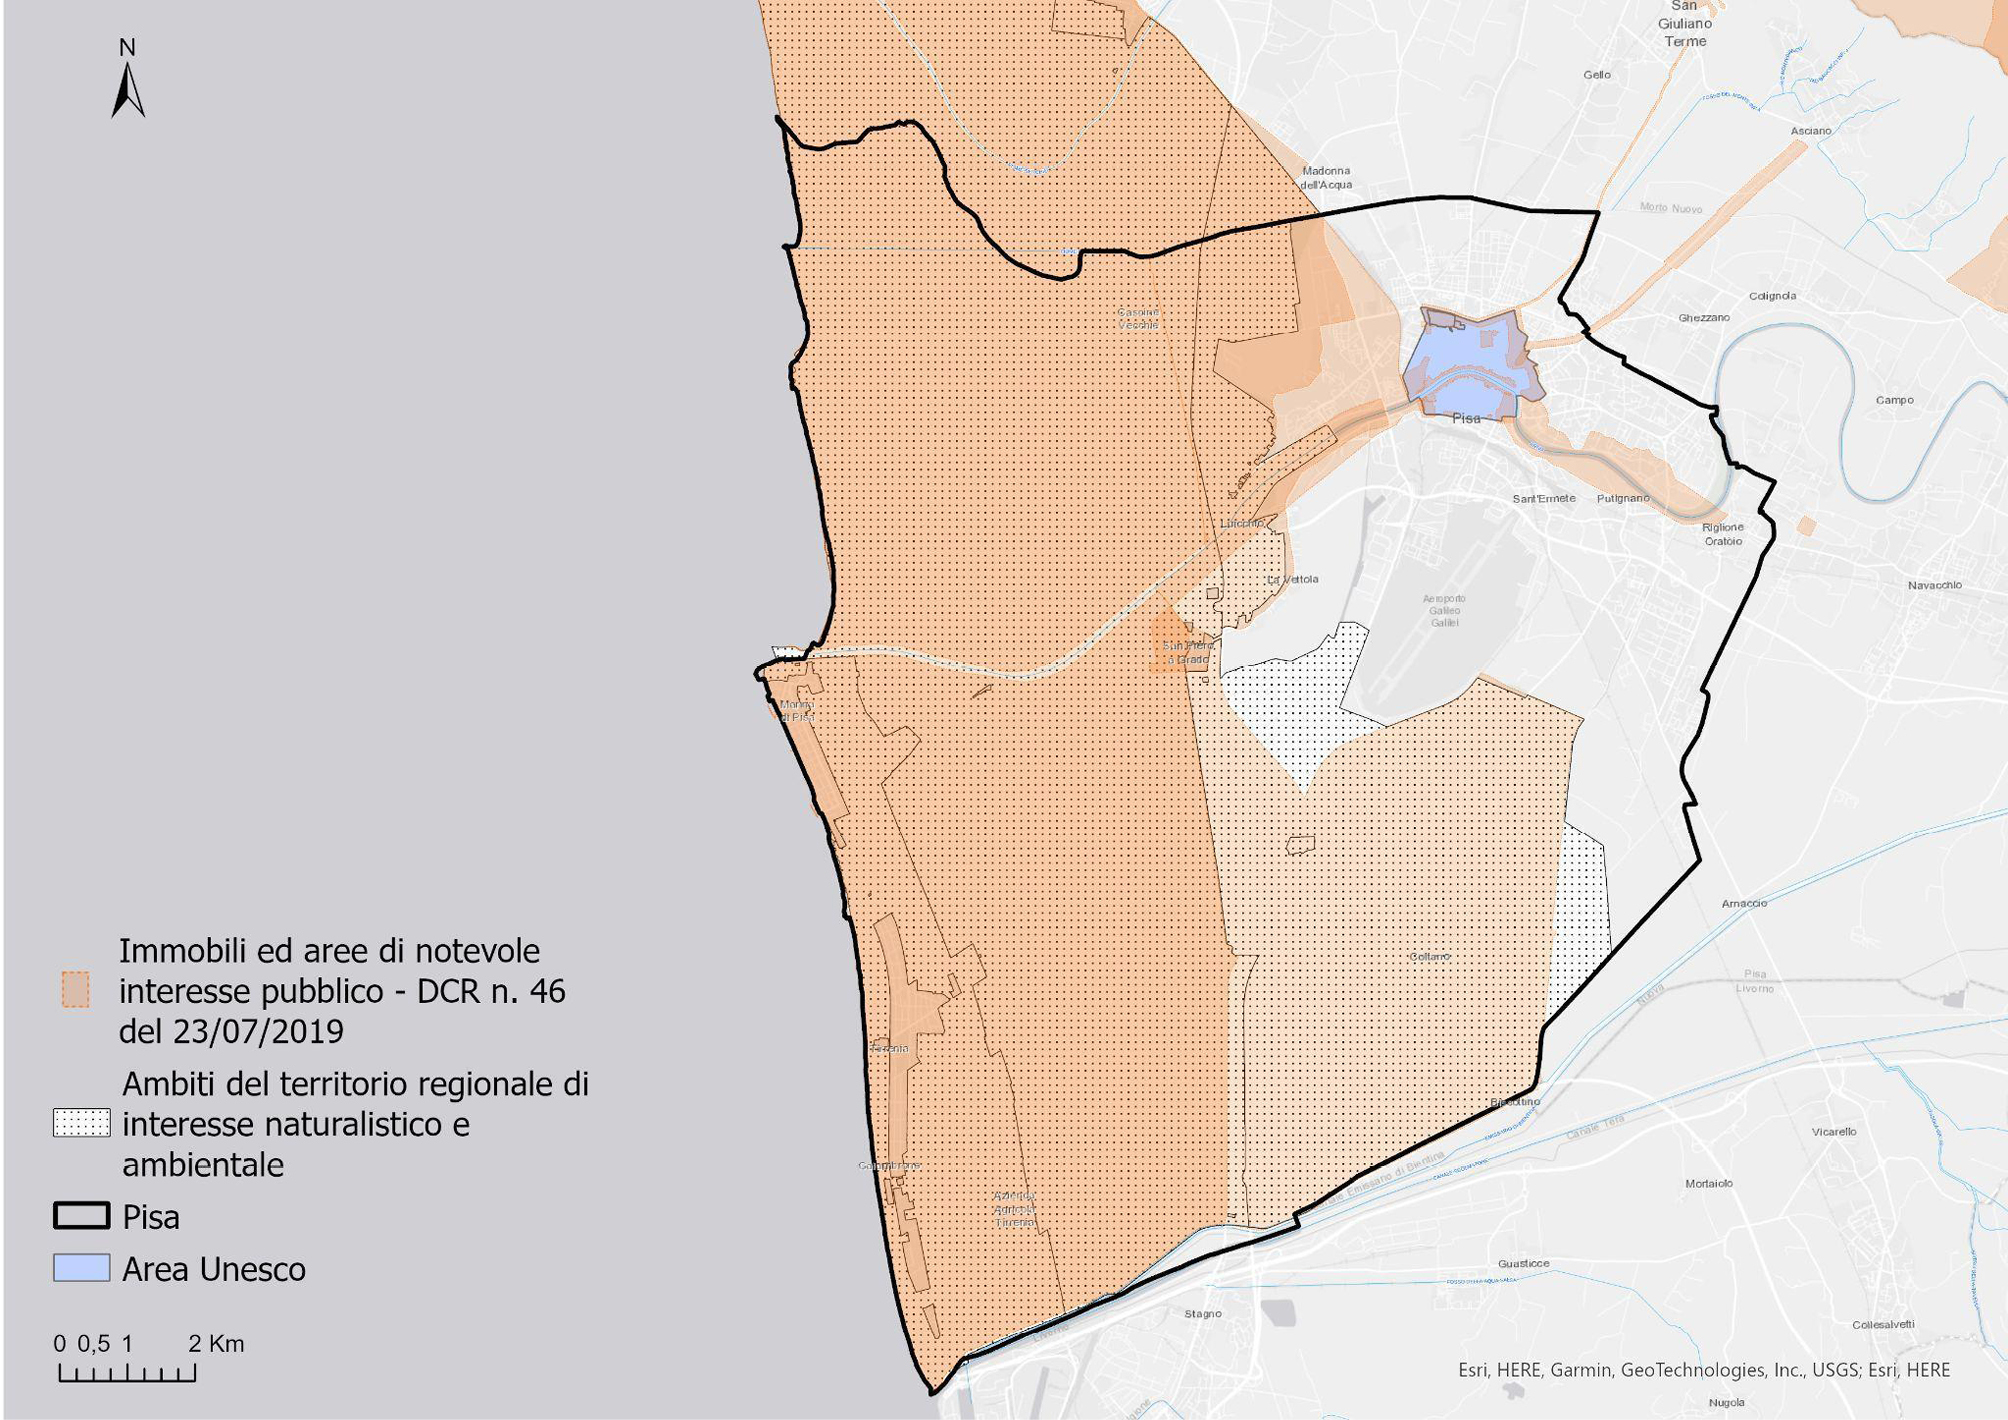
Thirdly, we gathered and spatially located 156 sites in the city of Pisa, as recognized by the local tourism authority’s website, Pisa Tourism (www.turismo.pisa.it). This collection encompasses various landmarks such as historical structures, museums, churches, thoroughfares, green spaces, and civic plazas. This sample represents the diversity of the city’s historical, architectural, natural and cultural assets and, although this compilation isn’t all-encompassing, it offers a representative overview, supported by a credible source. Furthermore, we map from GEOscopio – the webGIS tool with which it is possible to view, query and download the territorial data of the Tuscany Region – the buildings and the areas of notable public interest and the territorial areas of naturalistic and environmental interest (Fig. 4). This representation allows us to offer a broader framework of reference and to better site and reflect on the heritage and spatial trends connection.
Lastly, we experimented with a GeoAI model to predict the most preferred areas and their connection with such heritage distribution. This methodology is based on the Forest Base prediction of values at each location – specifically, the total number of walking trips per OpenStreetMap (OSM) edge – using an adaptation of the random forest algorithm. Random forest is a supervised machine learning technique that constructs multiple decision trees to create models and generate predictions. This approach is particularly suited for analyzing spatio-temporal data, as random forest leverages the power of multiple decision trees to process complex geospatial information, providing robustness, versatility, and high accuracy in tasks such as classification, regression, and pattern detection (Genuer et al. 2017). In the context of our specific case study, we consider the number of forward and reward trips per OSM edge monthly as the spatio-temporal inputs for the training of our deep learning model, then we apply the model aiming to forecast the total number of trips per OSM edge. The system used is the deep learning framework in ArcGIS Pro. It is important to note that the platform defines a “trip” as the crossing of a given edge by Strava users. This includes multiple crossings within a single activity, regardless of direction, whenever a user crosses the same edge multiple times. Within this specific framework, the areas highlighted in the following maps highlight and predict the paths most used as well as those never used by Strava users, offering a broad analytical framework on slow mobility in the city.
4. Results
The conceptual categories and analysis methodologies outlined in the preceding sections have allowed for an empirical investigation in the territory of the Municipality of Pisa, aimed at exploring the connection between mobility and heritage and experimenting with the contribution of big data and GeoAI.
Specifically, the area of Pisa experiences daily population exchanges (both in urban and metropolitan peri-urban areas) for various needs, resulting in a hub of attraction for economic, educational, cultural reasons, and not least, tourism. The city of Pisa (90,000 inhabitants) is characterized by the presence of a university system formed by the University of Pisa which hosts 45,000 students in buildings located mainly within the city and by two schools of excellence (Scuola Normale Superiore and Scuola Superiore Sant’Anna), located within the historic center. It represents a city that offers different types of services: economic and shopping activities in the main axes in the city center and peripheral areas; scientific with the presence of the CNR and other structures; healthcare with the activity of two hospitals (Santa Chiara e Cisanello) and a part of CNR, which also attract patients from other Italian regions; cultural (second-level schools, theatre, etc.). Furthermore, the city of Pisa and its metropolitan area are characterized by the presence of cultural and scenic assets that have a strong national and international tourist appeal, which brings a considerable increase in visitors to the area (1.6 million tourist presences in 2022, source: Municipality of Pisa). The proximity of the airport to the city and the growth of low-cost flights has generated a constant increase in tourists and workflows. Consequently, decision-makers and stakeholders involved in managing this territory must necessarily consider the characteristics of incoming and outgoing mobility in terms of quality and quantity and types of individuals, whether they are residents, commuters, workers, tourists, students, or retirees.
Our empirical analysis started from the representation of the existing natural and cultural heritage (Fig. 4) through the data derived from GEOscopio and of the area recognized by UNESCO, including both the core zone (the famous Piazza dei Miracoli) and the buffer zone, corresponding to the area located within the city walls. In particular, the representation highlights the areas within the historic center, where heritage of greatest artistic value are concentrated, especially along the Arno River and near the Historic walls, while other areas of significant public interest correspond to some axes (Viale delle Piagge, which extends from the center along the right bank of the Arno; road along the Roman aqueduct from Pisa to Asciano; seafront of Marina di Pisa), also frequented by the local population for walkability and leisure.
The Municipality of Pisa is also characterized by a vast area concerning naturalistic interests, within the Natural Park of Migliarino, San Rossore, and Massaciuccoli, which extends from North to South along the coast to the left and right hydrographic of the Arno River and about 4 km inland. The Park also includes the estate of Coltano, which originally constituted a vast marsh. The map (Fig. 4) serves as a reference point for the subsequent descriptions.
Figure 5, produced at the urban scale, represents a first attempt to correlate pedestrian movements with the main heritage emergencies indicated by the Municipality of Pisa (buildings, squares, streets, etc.), predominantly located in the historic center; there are also intense flows corresponding to other natural and cultural attractions located in peripheral areas, especially along the Arno or at specific points on the coast, testifying to the influence of heritage on spatial mobility trends.
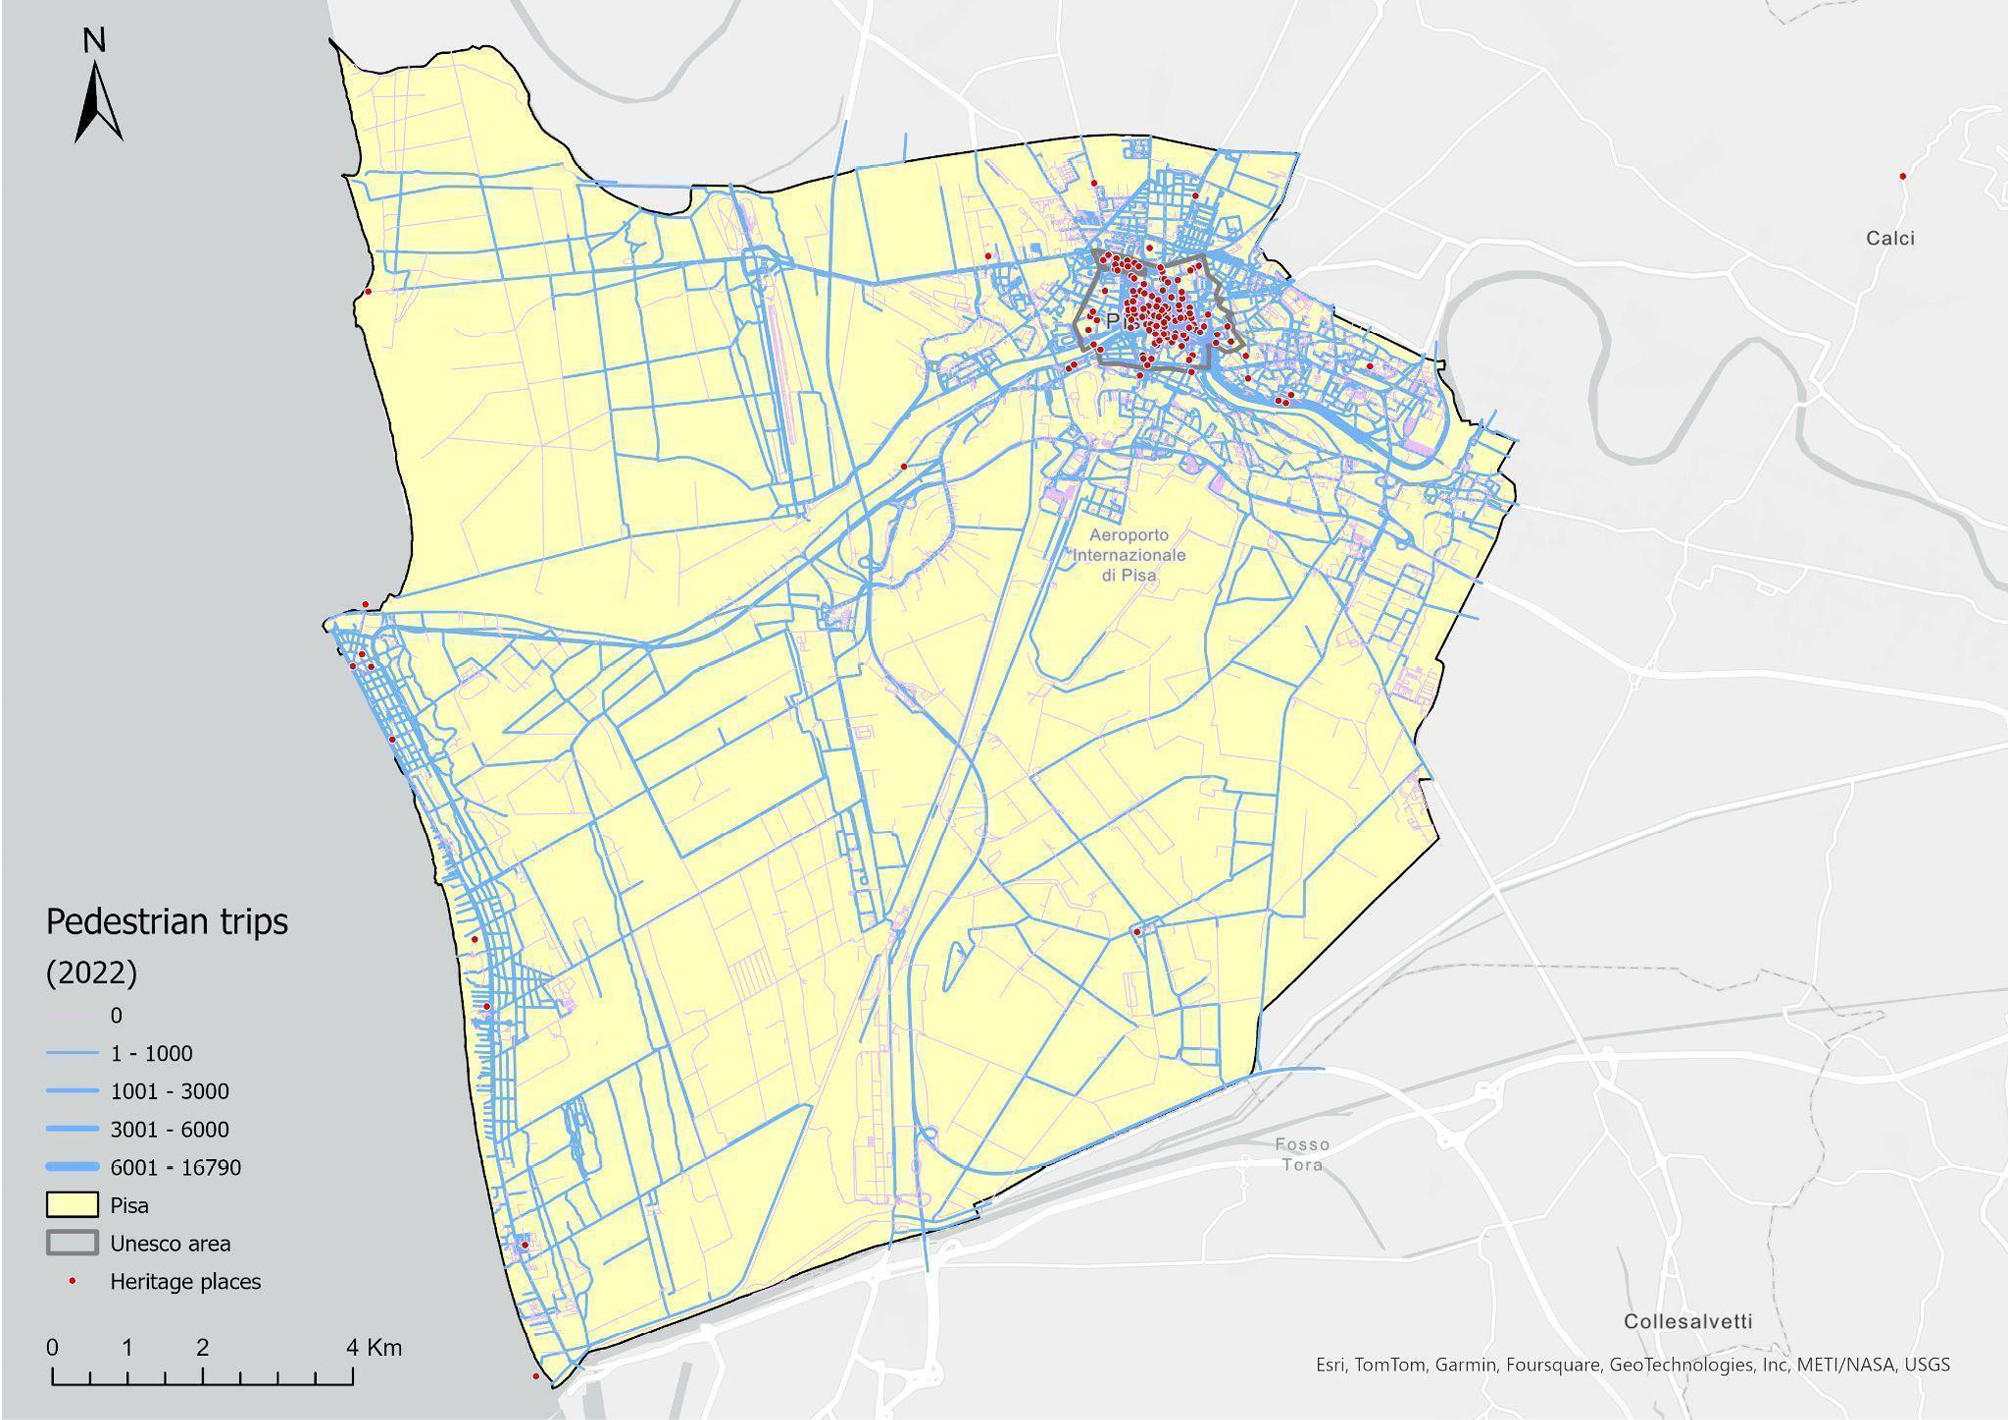
The intra-urban scale (Fig. 6) allows for a better visualization of mobility distribution, highlighting, on the one hand, the representation of flow space and its correlation with different categories of city users; on the other hand, the visual impact of alternating full and empty spaces returned by cartography, indicating the density of certain axes and the weakness of secondary areas.
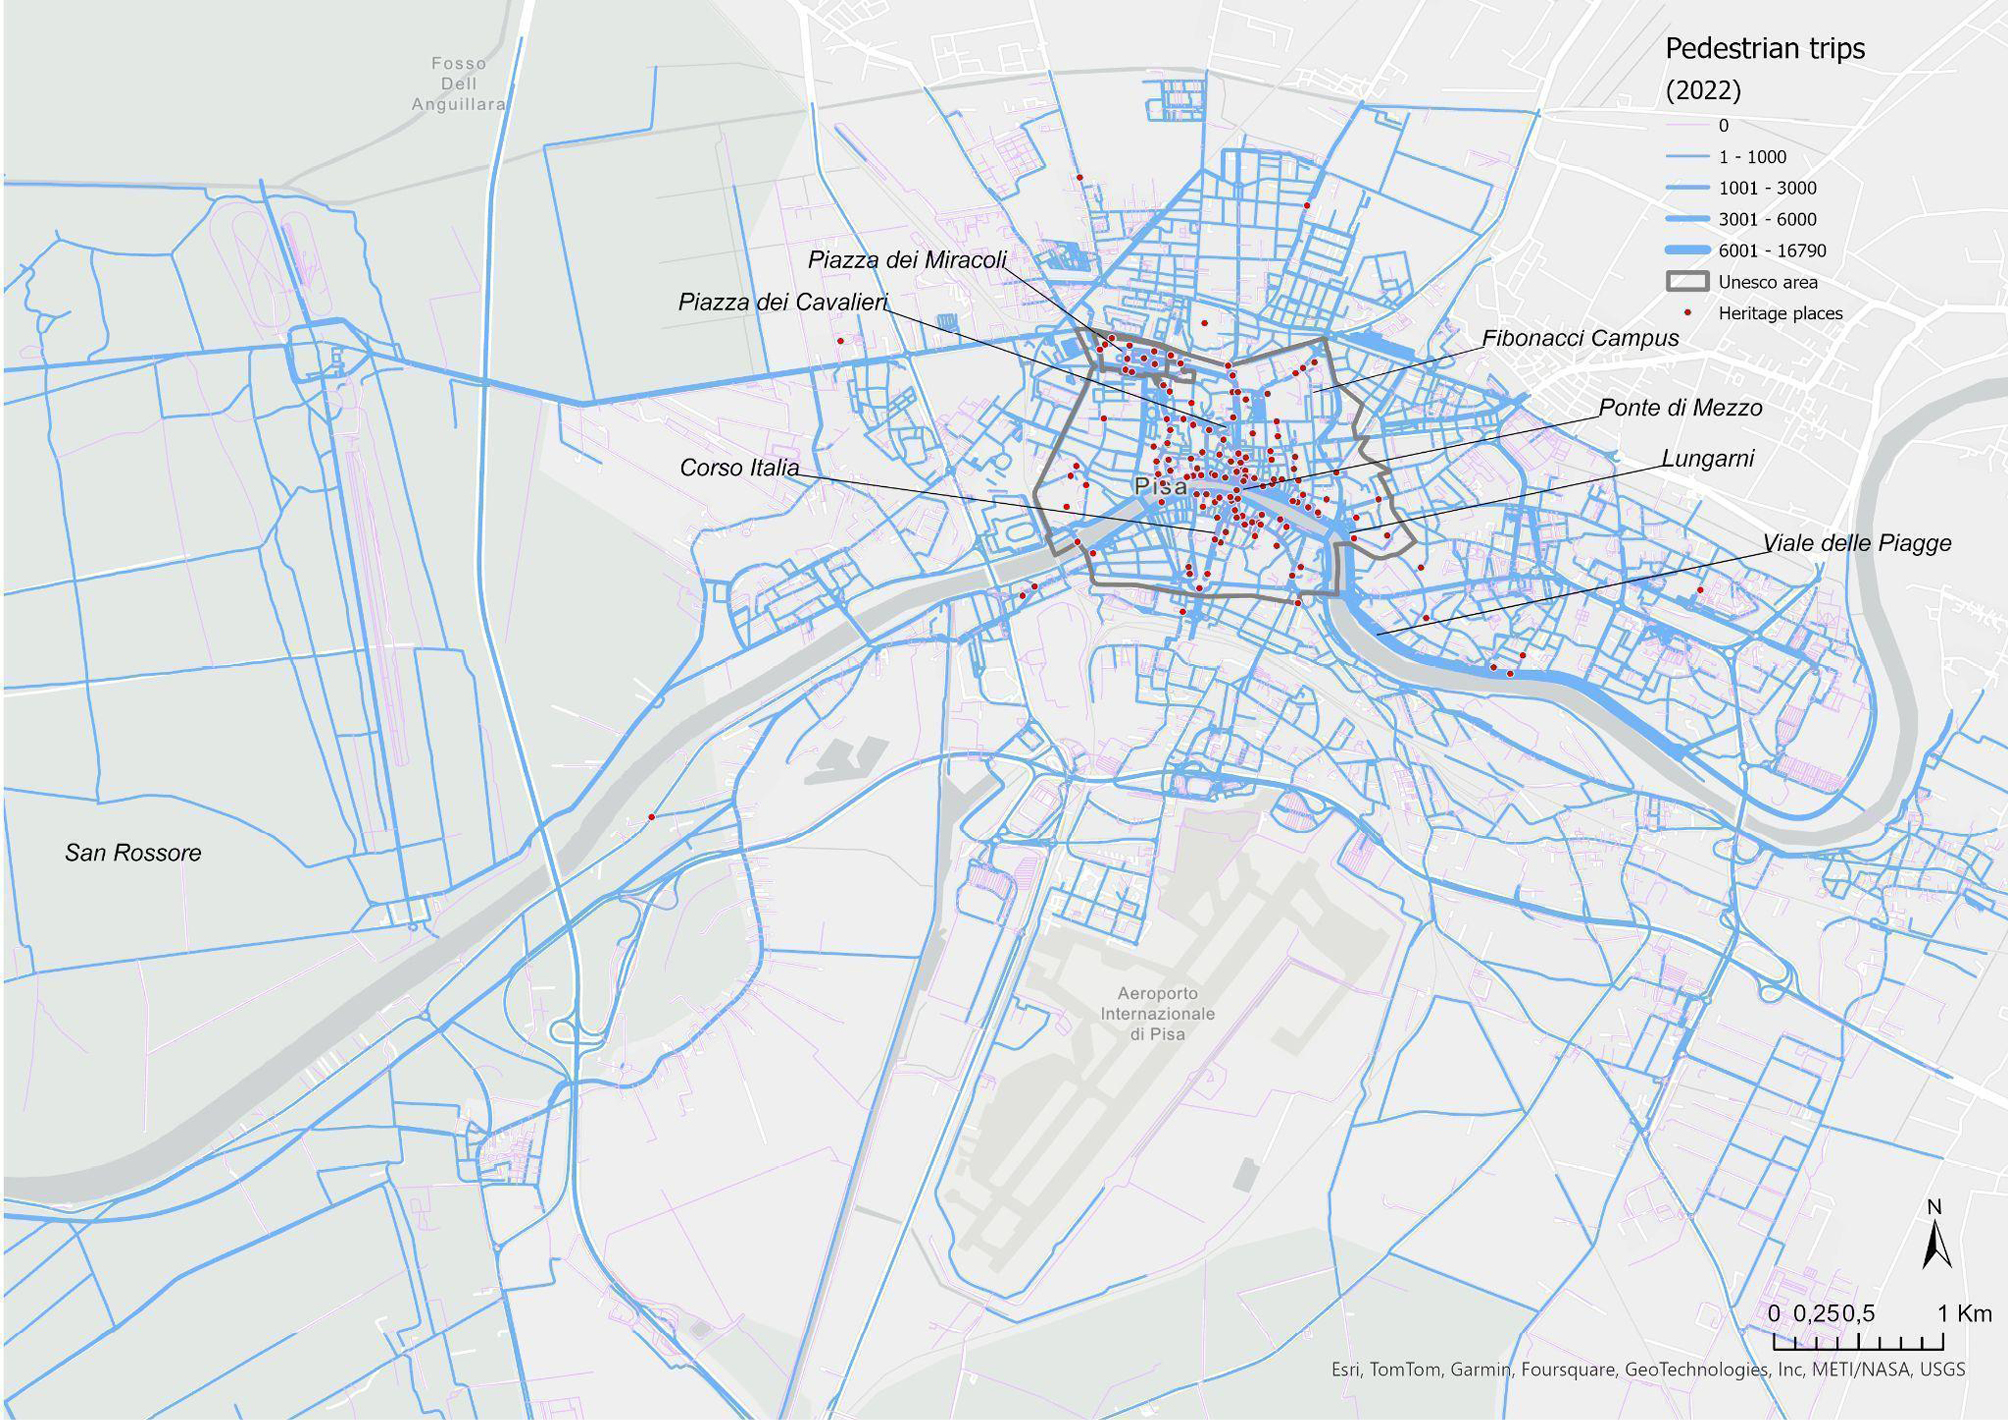
First, we can identify the most used routes to access or reach the most significant heritage elements, which can be attributed to different user categories. The crossing of the central axis from the station, Corso Italia, and Borgo, attracts city users for commercial or educational services; these are also the streets, along with others parallel to them, which are most frequented by tourists heading to the Piazza dei Miracoli and the Leaning Tower of Pisa, sometimes choosing to pass through other important cultural sites, such as Piazza dei Cavalieri and its famous buildings. These walking corridors are facilitated by urban regulations on pedestrian and traffic-restricted areas. The concentration of flows along the riverbanks highlights a hybrid use of space linked to the attractiveness of the overall view of the urban landscape, the presence of cultural venues such as museums, and the availability of meeting places and leisure areas used by the resident population and students. A heavily used route involves green areas (e.g., Viale delle Piagge and others along the Arno riverbank) thanks to recent pedestrian and cycling interventions, confirming how accessibility and walkability represent necessary conditions for the enjoyment and reappropriation of public spaces by citizens. Furthermore, two other significant axes can be observed, some more related to commuting and reaching the University campuses by students coming from the train station; the other concerns the road linking the city to the San Rossore Natural Park, recreational area for citizens, enhanced by the establishment of nearby healthcare and sports facilities.
The analysis of Strava data in Pisa and the interpretation of its cartographic representations highlight the influence of the heritage on mobility spatial trends; in particular, we can observe phenomena of polarization of flows on some arteries, which leave out streets and areas both in the historic center and in peripheral areas, whose use is predominantly residential or connected to other services. Therefore, slow mobility assumes a performative value and generates asymmetries of use, which are influenced by the location of heritage elements and likely to be reinforced by the effects of user imitation and mediation of the platform, which mainly suggests routes shorter or more traveled by other users. At the same time, certain interventions aimed at improving the walkability of specific areas have expanded mobility routes and enhanced the heritage experience.
Secondly, GeoAI and machine learning techniques make it easier to predict future trends and define walking scenarios in Pisa (Fig. 7), which can be useful for urban planning to strengthen the main axes or to intervene in less frequented areas. The results of the prediction model not only confirm previously highlighted patterns but also reinforce the significance of certain sections, particularly those related to the city’s main crossing routes along three key arteries: the direct route from the Station to the main tourist attractions (especially Piazza dei Miracoli); the central river banks, where a significant portion of young people’s leisure activities is concentrated, and where the flow of walkers and runners moves towards university sites and adjacent recreational areas; and the green corridors and parks, recently enhanced by the installation of gym equipment, the provision of cultural facilities (a library and an exhibition space), the construction of cycling and pedestrian lanes.
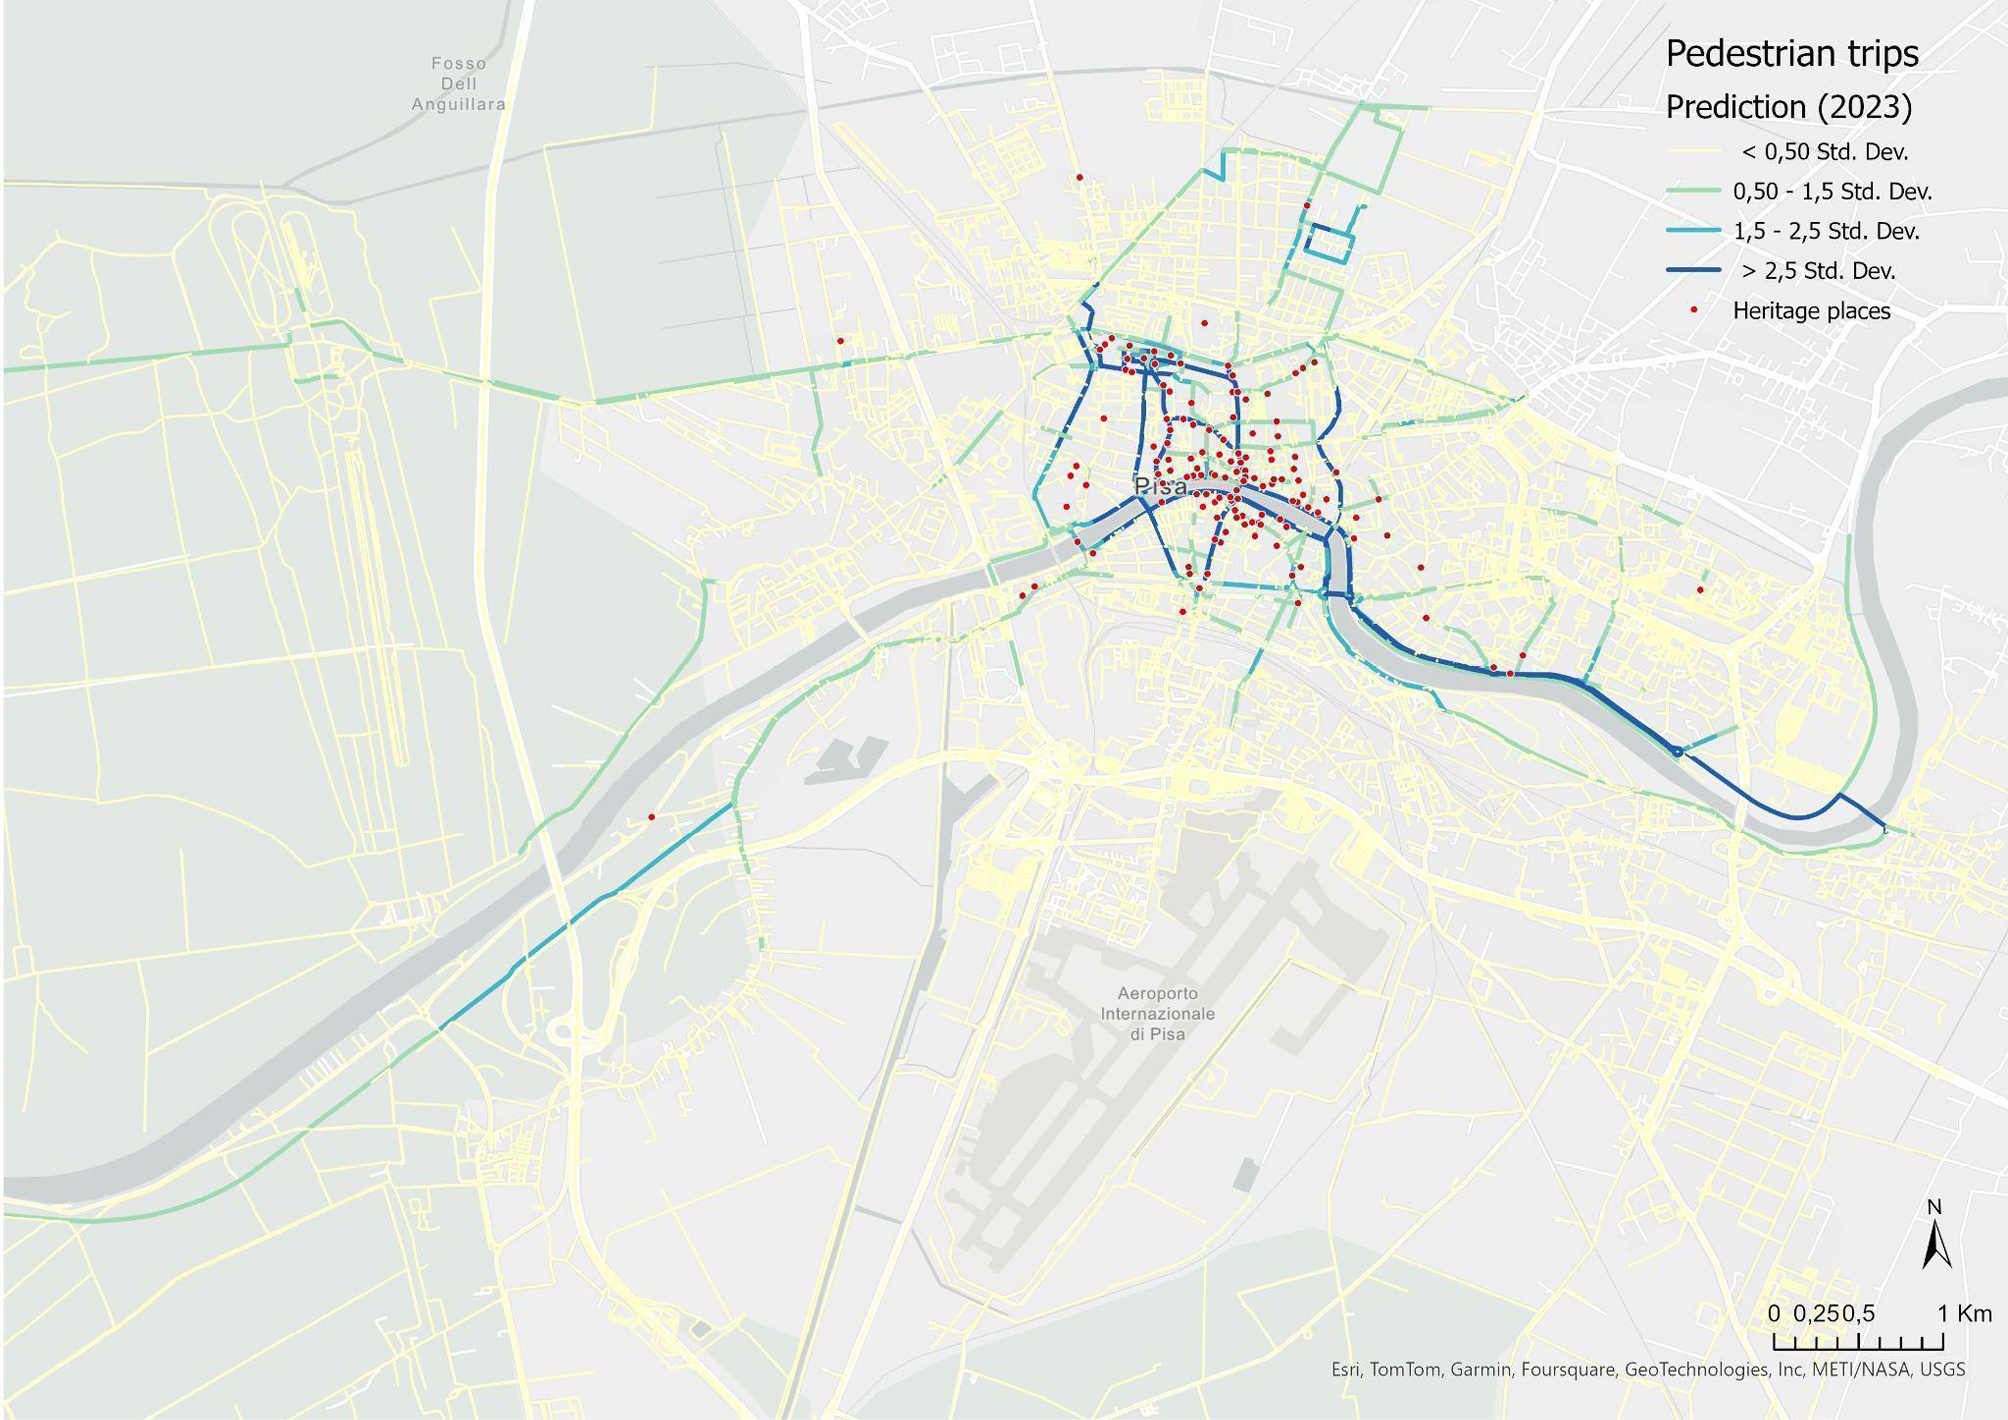
In synthesis, the empirical investigation, particularly the work on pedestrian trips prediction, highlights two trajectories. Firstly, the concentration of flows in certain urban spaces creates urban traffic in the historic center, experienced by various populations, including residents, tourists, and students. Consequently, to reduce conflicts over space use in urban crossings, it is useful to intervene in the enhancement of alternative routes that can also reinforce the visibility and promotion of secondary heritage elements, thereby expanding the tourist experience in the city and promoting a more balanced distribution of walking mobility. Secondly, the greater walkability present in some green spaces implies the urgency of promoting recreational and relational activities, in roads and areas that have so far been poorly accessible or underutilized.
5. Discussion and Conclusion
The contribution of this paper is to highlight the connection between slow mobility and heritage by adopting a spatial big data approach and experimenting with advanced GeoAI methodologies. The research uses quantitative analysis methodologies to advance the literature on the relationship between mobility and heritage (Cisani et al., 2022; Harvey 2024). These were designed to experiment with analysis models that can provide real-ime and predictive insights that are useful for monitoring slow mobility dynamics and reflecting on planning interventions. The paper also intends to make an original contribution to research and methodologies on big data, particularly Strava data (Lee, Sener 2021), introducing new methodologies for analyzing the nexus between slow mobility and urban heritage and experimenting with GeoAI-based models that can be replicated in other territorial contexts.
More precisely, the paper aimed to address three research questions, the results of which are discussed in the following points. Answering the first research question, the empirical analysis of the walking data extracted from the Strava platform and concerning the municipality of Pisa shows a strong influence of heritage on mobility spatial trends: 40% of walk trips take place within the Unesco area; 36.5% in areas of notable interest, therefore 76.5% of the total. On the contrary, 23.4% of trips take place outside these areas. These aspects are interesting, specifically in their spatial disaggregation and granularity, which makes it possible to shed light on slow mobility within the city over an entire time span (1 year).
The spatio-temporal combination of Strava Metro data and its connection to the heritage location can be considered innovative within both the mobility and heritage studies (Rolando, Scandiffio 2022). On the one hand, this has made it possible to have a mass of georeferenced data that was unthinkable until a few years ago and with characteristics that provide not only merely quantitative indications of the phenomenon but also qualitative ones that can be deduced from the analysis of user actions. In this sense, the data employed could constitute a precious pool from which to extrapolate information on mobility paths, behaviors, and most widespread practices of users. On the other hand, since it is georeferenced data, it could be possible to analyze them spatially in relation to the distribution of cultural and environmental goods and to produce maps that allowed for the visualization of mobility trajectories with a high degree of sophistication. An interesting aspect that emerges in these cartographic representations is the “presence” and “absence” of slow movements concerning cultural heritage. We could argue that the absence of a relationship weighs as much as the presence and can be subject to noteworthy temporal variations. The presence and absence patterns could be closely tied to time slots and describe different landscapes in their representation, with varying intensities of space appropriation by different types of city users, marked by the varying rhythms of the city at different times of the day and by seasonal cycles.
Considering the second research objective of this paper, our results can be useful both to assess the walkability of the city concerning the urban heritage fruition and thus to evaluate policies implemented or to create new ones closer to the mobility habits of users. It is possible to consider the role of heritage as an important driver in conveying these paths, but, at the same time, the pattern that emerged fosters the ability to read slow mobility trajectories that would otherwise remain unknown or only hypothesized. In this context, the focus on the nexus between walking and heritage sites can be crucial in the governance of specific spaces, as city users tend to explore heritage areas on foot to fully immerse themselves in the historical and cultural context, where the interwoven relationship among heritage, pedestrian accessibility, and slow mobility practices co-produce the landscape heritage. The adoption of a data-driven approach introduces a more critical discussion on the polarization flows, the potential spatial crossing conflicts, or the safety of the most used path emerging in some areas, in order to stimulate a scientific debate about urban solutions more oriented to a sustainable, healthier, and low-impact form of mobility (Bissell 2020; Maltese et al. 2017). The potential of Strava data and GeoAI in the predictive modeling of mobility scenarios through the analysis and construction of space-time models can also be useful for defining urban policies regarding traffic regulations and pedestrian routes. In our study, we highlight popular walking routes enabling city planners to make informed decisions about where to focus on heritage preservation efforts, improve infrastructure, or enhance accessibility. The results demonstrate that interventions could be implemented not only on established routes to improve the accessibility of heritage for city users but also in less frequented areas or those with lesser-known heritage. Such decisions could enhance the city experience for both tourists and residents while also creating more balanced urban mobility patterns to optimize walkability and improve quality of life.
Furthermore, this study intends to answer the third research question, focusing on the potential expressed by spatial big data from the Strava Metro platform and predictive models based on GeoAI applied to slow mobility to understand its connection with cultural and natural heritage. As demonstrated by Roy et al. (2019), we believe that this specific dataset can be considered as an additional or alternative source of geospatial information that can be useful to highlight paths that could be different from those already “offered”, thus generating valuable information for new mobility models (Romano, Capineri 2020) in areas where monitoring systems are absent or in which official data are poor or not available. The intersection of slow mobility data, with a focus on walking, and the georeferenced list of historical, artistic, and natural sites has made it possible to map the most frequently used routes and circuits, which would not have been identifiable using other data at this scale. Additionally, GeoAI techniques allow for the construction of predictive models based on processed data to anticipate future patterns and understand the most significant trends. As previously highlighted, these tools can, therefore, be valuable for urban planning and for introducing regulations on the use of specific spaces and cultural or natural assets. In particular, they offer the potential for further experimentation to: i) continuously monitor the phenomenon both spatially and temporally; ii) feed a city dashboard focused on urban slow mobility; iii) produce real-time analyses, maps, and models, and iv) provide guidance on how to manage heavily used routes and redirect flows to other parts of the city to enhance urban livability and heritage accessibility. In this sense, it will be important to explore the replicability of the model in other territorial contexts, both to verify the validity of the proposed data and GeoAI model and to undertake a comparative analysis.
At the same time, it is worth observing some limits of this methodological approach. First, the Strava data could underestimate the “mobile population” of the reference area, and the correlation between crowdsourced data and official data may vary by the local context (Fan, Lin 2019) in relation to different demographic, social, and physical characteristics, which influence the use of this kind of platform. In this sense, future research in this field could combine this dataset with other territorially coherent databases to better understand how a particular subset of city users is interacting with the urban and peri-urban space also in its dimension of cultural and environmental goods. Furthermore, it could be interesting to better understand how slow mobility conditions the heritage experience and the sense of (re)-appropriation of specific urban spaces, exploring in greater detail the practices and habits of users in correlation with other information which are available in the Strava database (e.g., gender and age) or which could be obtained through qualitative methodologies. Secondly, the crucial question concerns the quality of the model depending on the data source. Like all big data, spatial big data is not inherently free from inaccuracies or misrepresentations. A notable example in our case includes anomalies detected on some motorway routes: these anomalies could be caused by continuous tracking by users which occur unconsciously and confirm the veracity of big data and the importance of human interactions in an automated analysis process. As regards, this work intends to inspire a more critical examination, within and interdisciplinary scientific context, of the role spatial data plays as an input in machine learning (ML) systems and the need to explore such criticism from a geographical point of view. In this sense, in a data-intensive era, it’s important to acknowledge that spatial information can embody various biases, which we’ve identified, in this case, through a meticulous data mining analysis. Recognizing and addressing these biases is imperative when constructing training models for ML, especially when dealing with georeferenced crowdsourced spatial data at the micro-scale.
References
Annunziata, A., Garau, C. (2020). A Literature Review on Walkability and its Theoretical Framework. Emerging Perspectives for Research Developments. In Gervasi, O. et al. (Eds.). Proceedings of the International Conference on Computational Science and Its Applications – ICCSA 2020. ICCSA 2020. Lecture Notes in Computer Science, vol 12255. Cham, Springer, 422-437. https://doi.org/10.1007/978-3-030-58820-5_32
Balletto, G., Milesi, A., Battino, S., Borruso, G., Mundula, L. (2019). Slow Tourism and Smart Community. The Case of Sulcis - Iglesiente (Sardinia -Italy). In Misra, S. et al. (Eds.). Proceedings of the International Conference on Computational Science and Its Applications – ICCSA 2019. Lecture Notes in Computer Science, vol 11624. Cham, Springer. https://doi.org/10.1007/978-3-030-24311-1_13
Bissell, D. (2020). Mobilities and place. In Edensor, T., Kalandides, A., & Kothari, U. (Eds.). The Routledge Handbook of Place. London and New York, Routledge.
Chapin, F.S. Jr. (1974). Human Activity Patterns and the City: Things People Do in Time and in Space. New York, Wiley.
Chapin, F.S. Jr. (1978). Human Time Allocation in the City. In Carlstein, T., Parkes, D.N., Thrift, N.J. (Eds.). Human Activity and Time Geography. London, Edward Arnolds, 13-26.
Cisani, M., Lo Presti, L., Pearce, L., Peterle, G., Rabbiosi, C. (2022). Introduction. Unruly Landscapes: Mobility, Transience, and Transformation. Transfers, 12(1), 3-8. DOI: https://doi.org/10.3167/TRANS.2022.120102
Cresswell, T. (2006). On the move: Mobility in the modern western world. New York, Taylor & Francis.
Daniels, P.W., Warnes, A.M. (1980). Movement in Cities: Spatial Perspectives on Urban Transport and Travel. London, Methuen.
Fan, W., Lin, Z. (2019). Evaluating the potential use of crowdsourced bicycle data in North Carolina. Charlotte (NC), The University of North Carolina at Charlotte, Center for Advanced Multimodal Mobility Solutions and Education.
Genuer, R., Poggi, J. M., Tuleau-Malot, C., Villa-Vialaneix, N. (2017). Random forests for big data. Big Data Research, 9, 28-46. DOI: https://doi.org/10.48550/arXiv.1511.08327
Giaccardi, E. (Eds.). Heritage and social media: Understanding heritage in a participatory culture. London, Routledge.
Greene, M., Rau, H. (2018). Moving across the life course: A biographic approach to researching dynamics of everyday mobility practices. Journal of Consumer Culture, 18(1), 60-82. https://doi.org/10.1177/1469540516634417
Jiang, Z., & Shekhar, S. (2017). Spatial big data science. Schweiz, Springer International Publishing AG.
Harvey, D.C. (2015). Landscape and heritage: trajectories and consequences. Landscape Research, 40(8), 911-924. DOI: https://doi.org/10.1080/01426397.2014.967668
Harvey D.C. (2024). Traces of mobility in the landscape: creative possibilities of everyday heritage practice. Landscape Research, 50(2), 351-367. DOI: https://doi.org/10.1080/01426397.2024.2377207
Heesch, K. C., James, B., Washington, T. L., Zuniga, K., Burke, M. (2016). Evaluation of the Veloway 1: A natural experiment of new bicycle infrastructure in Brisbane. Australia. Journal of Transport and Health, 3(3), 366-376. DOI: https://doi.org/10.1016/j.jth.2016.06.006
Hochmair, H. H., Bardin, E., Ahmouda, A. (2019). Estimating bicycle trip volume for Miami-Dade County from Strava tracking data. Journal of transport geography, 75, 58-69. DOI: https://doi.org/10.1016/j.jtrangeo.2019.01.013
Huber, S., Lißner, S. (2019). Disaggregation of aggregate GPS-based cycling data — How to enrich commercial cycling data sets for detailed cycling behavior analysis. Transportation Research Interdisciplinary Perspectives, 2, 100041. DOI: https://doi.org/10.1016/j.trip.2019.100041
Hui, A. (2013). Moving with practices: The discontinuous, rhythmic and material mobilities of leisure. Social & Cultural Geography, 14(8), 888-908. DOI: https://doi.org/10.1080/14649365.2013.827736
Kitchin, R. (2014). Big Data, new epistemologies and paradigm shifts. Big data & society, 1(1). DOI: https://doi.org/10.1177/2053951714528481
Knapskoga M., Hagena O. H., Tennøya A., Rynning M. K. (2019). Exploring ways of measuring walkability. Transportation Research Procedia, 41, 264-282. DOI: https://doi.org/10.1016/j.trpro.2019.09.047
Lee, K., Sener, I. N. (2021). Strava Metro data for bicycle monitoring: a literature review. Transport reviews, 41(1), 27-47. DOI: https://doi.org/10.1080/01441647.2020.1798558
Lee, R. J., Sener, I. N., Mullins, J. A. (2016). An evaluation of emerging data collection technologies for travel demand modeling: From research to practice. Transportation Letters, 8(4), 181-193. DOI: 10.1080/19427867.2015.1106787
Leslie E., Coffee N., Frank L., Owen N., Bauman A., Graeme H. (2007). Walkability of local communities: Using geographic information systems to objectively assess relevant environmental attributes. Health & Place, 13, 111-122. DOI: https://doi.org/10.1016/j.healthplace.2005.11.001
Leszczynski, A., Crampton, J. W. (2016). Introduction: The Spatial Big Data Debate, Big Data & Society, 3(2), 1-12. DOI: https://doi.org/10.1177/2053951716661366
Liu, P., Biljecki, F. (2022). A review of spatially-explicit GeoAI applications in Urban Geography. International Journal of Applied Earth Observation and Geoinformation, 112, 102936. DOI: https://doi.org/10.1016/j.jag.2022.102936
Maltese I., Mariotti I., Oppio A., Boscacci F. (2017), Assessing the benefits of slow mobility connecting a cultural heritage. Journal of Cultural Heritage, 26, 153-159. DOI: https://doi.org/10.1016/j.culher.2017.01.006
Martinotti, G. (1993). Metropoli. La nuova morfologia sociale della città. Bologna il Mulino.
Martinotti, G. (1999). A City for Whom? Transients and Public Life in the Second-Generation Metropolis. In Beauregard, R.A., Body-Gendrot, S. (Eds.). The Urban Moment. Cosmopolitan Assays in the Late-20th Century City. London, Sage, 155-183.
Morri, R. (2003). I city users. In Cristaldi F. (a cura di). Le mille popolazioni metropolitane. Un’analisi geografica dell’area romana. Roma, Università degli Studi di Roma La Sapienza, 77-116.
Mortaheb, R., Jankowski, P. (2023). Smart city re-imagined: City planning and GeoAI in the age of big data. Journal of Urban Management, 12(1), 4-15. https://doi.org/10.1016/j.jum.2022.08.001
Nikielska-Sekuła, K., Banaszkiewicz, M. (2025). Heritage and Mobility from a Multisensory Perspective. In Banaszkiewicz, M., Nikielska-Sekuła, K. (Eds.). Heritage and Mobility from a Multisensory Perspective. London / New York, Routledge, 1-15.
Nuvolati, G. (2007). Mobilità quotidiana e complessità urbana. Firenze, Firenze University Press.
Rolando, A., Scandiffio, A. (2022). Multimodal Access to Minor Places in Heritage-Rich Landscapes: GIS Mapping to Define Slow-Tourism Routes from the Stations in the Railway Networks in-between Turin and Milan. Sustainability, 14, 15723. DOI; https://doi.org/10.3390/su142315723
Romano, A. (2022). La geografia delle piattaforme digitali. Mappe, spazi e dati dell’intermediazione digitale. Firenze, Firenze University Press. DOI: https://doi.org/10.36253/978-88-5518-602-5
Romano, A., Capineri, C. (2020). Piattaforme e Big data per una nuova geografia digitale. In Lazzeroni M., Morazzoni M. (Eds.). Interpretare la quarta rivoluzione industriale. La geografia in dialogo con le altre discipline. Roma, Carocci editore, 227-240.
Roy, A., Nelson, T. A., Fotheringham, A. S., Winters, M. (2019). Correcting bias in crowdsourced data to map bicycle ridership of all bicyclists. Urban Science, 3(62), 1-20. DOI: https://doi.org/10.3390/urbansci3020062
Sheller, M., Urry, J. (2006). The new mobilities paradigm. Environment and Planning A, 38(2), 207-226. DOI: 10.1068/a37268
Shields, R., Gomes da Silva, E. J., Lima e Lima, T., Osorio, N. (2021). Walkability: a review of trends. Journal of Urbanism: International Research on Placemaking and Urban Sustainability, 16(1), 19-41. DOI: https://doi.org/10.1080/17549175.2021.1936601
Singh, R. (2016). Factors affecting walkability of neighborhoods. Urban Planning and Architecture Design for Sustainable Development, 216, 643-654. DOI: https://doi.org/10.1016/j.sbspro.2015.12.048
Sun, Y., Mobasheri, A. (2017). Utilizing crowdsourced data for studies of cycling and air pollution exposure: A case study using Strava data. International journal of environmental research and public health, 14(3), 274. DOI: https://doi.org/10.3390/ijerph14030274
Solnit, R. (2001). Wanderlust. A history of walking. New York, Penguin.
Van Der Zee, E. L., Bertocchi, D., Janusz, K. (2017). Using Big Data to discover how the maturity of a heritage destination influences the use and attractiveness of urban cultural landscape. A case study of Antwerp, Bolzano and Kraków. In Proceedings of TLC2016 Conference–Tourism and cultural landscape: Towards a sustainable approach. Foundation for Information Society (INFOTA), 614-628.
Venter, Z. S., Gundersen, V., Scott, S. L., Barton, D. N. (2023). Bias and precision of crowdsourced recreational activity data from Strava. Landscape and Urban Planning, 232, 104686.
Visentin, C. (2021). Slowness to Discover the Ordinary Italian Landscape. In Pileri, P., Moscarelli, R. (Eds.). Cycling & Walking for Regional Development, Research for Development. Cham, Springer, 63-81. DOI: https://doi.org/10.1007/978-3-030-44003-9_6