https://doi.org/10.36253/bsgi-7527
The Intensity and Velocity of Ageing Process in Italy at Local Scale: an Empirical Investigation
Intensità e velocità del processo di invecchiamento in Italia su scala locale: un’analisi empirica
1 Department of Political Sciences, University of Naples Federico II, Naples, Italy
2 Institute for Research on Population and Social Policies, National Research Council, Rome, Italy
E-mail: federico.benassi@unina.it; alessio.buonomo@unina.it; salvatore.strozza@unina.it
Abstract. The paper proposes an empirical investigation about the spatial dimension of two indicators related to the ageing process: the share of elderly population at the beginning of 2022 and the change (percentage points) in the share of elderly from 2002 to 2022. These two indicators inform, respectively, on the intensity of the process (levels) and on the velocity of the process (variation in levels). Both are computed on a local scale (municipality). Empirical analysis will focus on describing the geographical distribution of these indicators and in particular in detecting their level of global and local spatial autocorrelation by means of univariate and bivariate spatial autocorrelation measures. The hypothesis on which the paper is based upon is that, on a local scale, an inverse spatial relationship may exist between the intensity and velocity of ageing process in Italy.
Keywords: ageing process, local scale, spatial demography, spatial autocorrelation, Italy.
Riassunto. Il contributo propone un’indagine empirica sulla dimensione spaziale di due indicatori relativi al processo di invecchiamento: la quota di popolazione anziana all’inizio del 2022 e la variazione (in punti percentuali) della quota di popolazione anziana dal 2002 al 2022. Questi due indicatori forniscono informazioni, rispettivamente, sull’intensità del processo (livelli) e sulla velocità del processo (variazione dei livelli). Entrambi sono calcolati su scala locale (comunale). L’analisi empirica si concentrerà sulla descrizione della distribuzione geografica di questi indicatori e, in particolare, sull’individuazione del loro livello di autocorrelazione spaziale globale e locale, attraverso misure di autocorrelazione spaziale univariata e bivariata. L’ipotesi su cui si basa l'articolo è che possa esistere, su scala locale, una relazione spaziale inversa tra l’intensità e la velocità del processo di invecchiamento in Italia.
Parole chiave: processo di invecchiamento, scala locale, demografia spaziale, autocorrelazione spaziale, Italia.
Contents
3. Ageing process in Italy: towards a multiscale comprehension of patterns and dynamics
3.1 The ageing process in Italy at macro-regional and regional level
3.2 The ageing process at the local level: intensity and velocity
3.3 The ageing process at the local level: spatial autocorrelation analysis
1. Introduction
The ageing of the population represents one of the most significant demographic challenges facing developed countries where the proportion of elderly individuals continues to rise sharply (van Nimwegen, Van der Erf 2010). Our paper addresses this issue at the local spatial level, focusing on the municipal scale in the Italian case. This approach is crucial as it captures the heterogeneous nature of demographic ageing across and within regions. Understanding ageing at a detailed spatial level allows more targeted interventions, facilitating policies that better reflect local disparities and needs within broader regional and national trends (De Castro 2007). This local scale approach is particularly relevant as Europe faces a significant increase in its elderly population, marked by considerable spatial heterogeneity (Káčerová et al. 2014; Nicolini, Roig 2024). Official projections on the age structure of the European population over the next years agree that the growing share of older people in the total population will intensify over the course of the current century. According to these estimates, in 2050, people aged 80 and over will make up at least 10 per cent of the population in almost all major European countries and the population aged 65 and over will account for approximately 30 per cent (Eurostat 2023).
Levels of fertility, mortality and migration are the main demographic determinants of the size and age structure of the population. Before the late nineteenth century, European countries were characterised by relatively stable long-term mortality, fertility and migration values, resulting in an almost constant age structure (Bengtsson 2001). Clark (2007) suggests that the ancient Malthusian demographic system persisted until around 1800, when it began to give way to modern demographic patterns. However, the decline in mortality began around the mid-eighteenth century (this decline, which occurred at varying times across Europe, has led to significant structural transformations that are now evident throughout the continent), as the great plagues subsided, signalling a gradual shift in the demographic landscape. During the latter part of the nineteenth century, the percentage of the population aged 60 years and over remained almost constant at around 9 per cent (Wrigley, Schofield 1989). Around the beginning of the twentieth century, mortality and fertility levels decreased significantly. Falling levels in these demographic indicators occurred at different times in the countries of Europe, sometimes involving important spatial heterogeneities (Lesthaeghe, Lopez-Gay 2013; Gortfelder, Jaadla 2023); however, today this demographic transition can be considered complete in all European countries. Specifically, both fertility and mortality declined later in southern and eastern Europe than in northern and western countries (Chesnais 1990).
Population ageing is primarily due to declining fertility (Coale 1956; Bengtsson, Scott 2010) and, to a lesser extent, to migration. The gradual decline in fertility evidently leads to a reduction in the share of children and young people in the population and, consequently, the number of potential future parents. This implies that the elderly, being survivors of previous larger birth cohorts, represent a larger share of the population. In most European countries, fertility rates continued (or began) to decline in the first decades of the twentieth century. After the Second World War, a growth in births (the baby boom) occurred, more pronounced in northern and western regions than in southern Europe, though without returning to the fertility levels observed at the beginning of the twentieth century. In many European countries, a period of sharply declining birth rates followed in the 1970s (Reher 2015). Since then, total fertility rates in much of northern and western Europe have fallen below two children per woman. Even lower were the total fertility rates in southern and eastern Europe, but also in Germany (Kohler et al. 2002). Moreover, over time, deaths in all European countries have been occurring at an increasingly older age. Over the past decade, reductions in the overall level of mortality are mainly the result of improved survival beyond the age of 65: in fact, just under 80 per cent of deaths in Europe occur after the age of 65 (Preston, Stokes 2012). These demographic trends have led to major increases in the number of elderly people due to the ageing of the cohorts born in the baby boom period, accompanied by continued low fertility and low mortality levels over time.
The demographic phenomenon of international migration plays a role in curbing the ageing process described so far (Plane 2012). In fact, international immigration in Europe is a growing phenomenon. Those who immigrate generally have a relatively young working age. Moreover, immigrants generally have higher fertility rates than the population of the destination country. However, fertility rates of immigrants tend to decline and approach those of the native population. Obviously, immigrants also age, so unless they return to their country of origin, they too will contribute to the growth of the older population in the long run (Grundy, Murphy 2017). For this reason, international immigration can be a recipe for reducing the ageing population only in the short and medium term.
The acceleration in the process of population ageing certainly represents one of the most important demographic challenges of both current and future policy. Ageing process has indeed strong repercussions for policies related to health, pension systems and care (Longman 2004; OECD 2006). A first effect of the progressive ageing of the population is the growing imbalance between the number of people of retirement age and the number of people of working age. This imbalance makes the sustainability of pension systems more complex. Consequently, some countries have already implemented policies to postpone (to an older age) state pensions and eliminate mandatory retirement and have made early retirement more difficult (Künemund, Kolland 2007).
The imbalance of the age structure in favour of the elderly also implies a redefinition of family structures and interconnections. Indeed, more and more elderly people will need care, but fewer and fewer family members will be able to take care of them due to the increasing number of divorces and separations and the decreasing number of children (Grundy, Murphy 2017). The results of some international research have also questioned the readiness of the younger generation to help their elderly parents (Grundy, Murphy 2017). In fact, the meaning and value of the family and its durability are changing. As a result, an increasing and important number of elderly people are observed to be living alone, and a decreasing number of younger people are willing to provide care for their elderly parents (Sundström 1994; Lesthaeghe 2010). Although spending one’s old age living alone can be an expression of independence and self-sufficiency, it can also lead to social exclusion, loneliness, and making important services inaccessible (Plouffe, Kalache 2010). Of course, the vulnerability of the elderly is not the same across territories, depending on background, wealth, neighbourhoods in which families live and a range of other factors. For this reason, the analysis of the spatial distribution of the elderly population is of central importance for the development and refinement of effective, appropriate, and adequate support strategies that address the needs of a spatially stratified ageing population (Reynaud et al. 2018; Channer et al. 2020). Given the current outlook for population ageing, understanding how this process differs spatially is critical to developing targeted policy interventions and creating a society more tailored to the needs of the population (Voss 2007).
While these broad demographic trends are well understood at the national and regional levels, less is known about how ageing unfolds at finer spatial scales, particularly in local contexts. Understanding these local dynamics is critical for designing targeted interventions, as the socioeconomic impacts of ageing vary widely across and within regions. However, much of the existing literature on ageing has mainly focused on national trends, overlooking the importance of spatial heterogeneity in demographic processes.
This paper seeks to contribute an in-depth, spatially explicit analysis of this phenomenon, focusing on Italy. By investigating ageing at a local level, the study aims to uncover spatial patterns that may not be visible on broader regional scales. This approach is relatively novel in the field, as few studies provide a granular spatial understanding of ageing dynamics within a country. Understanding these patterns is essential for formulating targeted, place-based policy interventions. What this paper aims to do is twofold. Firstly, it examines two indicators related to ageing: the share of elderly population at the beginning of 2002 and of 2022, and the change (percentage points) in the share of elderly from 2002 to 2022. These indicators inform, respectively, on the intensity of the process (levels) and the velocity of the process (variation in levels). Both are computed on a local scale (municipality). Secondly, empirical analysis will focus on describing the geographical distribution of these indicators, detecting their level of global and local spatial autocorrelation by means of univariate and bivariate spatial autocorrelation measures. The hypothesis upon which the paper is based is that, on a local scale, an inverse spatial relationship may exist between the intensity and velocity of the ageing process in Italy as a result of a process of convergence (or diffusion).
The structure of the paper is as follows. In the next section, the data and methods used in the empirical analysis are described. In section 3, the results are presented, including a brief overview of the population ageing process on the regional and macro-regional scale. Section 4 offers a discussion of the results obtained and outlines some conclusions and future developments.
2. Data and methods
For our empirical analysis, we employ data produced by the Italian National Institute of Statistics (ISTAT). We gathered intercensal and municipal population estimates, including their respective demographic balances, for the periods 2001–2018 and 2019–2021, respectively. To take into account the maximum level of spatial heterogeneity and given the importance and urgency for statistics and society of thinking locally (Fotheringham, Sachdeva 2022), the analysis is conducted on the municipal scale. This scale of analysis implies several complications because, as known, the number and the boundaries of statistical units (Italian municipalities) change over time. For this reason, the municipal geographies are reconstructed for the year 2022 and are constant throughout the analysis. Empirical analysis is based upon two indicators computed at municipal level: (i) the share (in percentage) of elderly population (the population aged 65 and over, P65+) at the beginning of 2002 and 2022 (SEP); and (ii) the change (in percentage points) in the share of elderly population from 2002 to 2022 (CEP). The two indicators for each municipality have been computed as follows:
(1)
(1a)
(2)
SEP informs us about the intensity of the ageing process while CEP tells us something about the velocity of the process. The quantitative analysis is based on spatial (explorative) techniques that have been already used in population studies (Galeano, Bayona-i-Carrasco 2018; Salvati et al. 2020; Benassi, Carella 2023).
In a first part of the paper, thematic maps will allow us to appreciate the geographical distribution of the indicators (SEP and CEP) and to evaluate spatial patterns. A second part of the paper is devoted to analysing the level of spatial autocorrelation (global and local) of the indicators in both a univariate and bivariate way. For each of the indicators (SEP and CEP), we firstly compute the global (Moran 1948) and local (Anselin 1995) univariate version of Moran’s I. A bivariate version of both the global and local version of the indicator is then proposed (Anselin et al. 2002). Below, we provide additional details regarding these indicators.
According to Anselin (2024), Moran’s I is a cross-product statistic between a variable (SEP and CEP, in our case) and its spatial lag, the variable being expressed in deviation from its mean. For an observation at location i, this is expressed as , where is the mean value of . Univariate global Moran’s I is then:
(3)
with as the elements of the spatial weights matrix, as the sum of all the weights, and as the number of observations (the Italian municipalities in our case). Moran’s, I varies from -1 to 1. A positive (and statistically significant) global univariate Moran’s I index indicates spatial dependence; conversely, a negative (and statistically significant) global univariate Moran’s I index indicates spatial dispersion. Global univariate Moran’s I (equation 3) cannot reveal the local dimension of the observed process. Anselin (1995) proposed the local version of Moran’s I (Ii) to identify local clusters and local spatial outliers. Continuing to follow Anselin’s notation (2024), univariate local Moran’s can be defined as:
(4)
That is, the product of the value at location i with its spatial leg and the weighted sum of the values at neighbouring locations. In equation 4, with the z is deviation from the mean (or fully standardised, such that the variance equals to one) and represents elements of the spatial weights matrix, as mentioned above. As explained by Anselin (1995), global Moran’s I corresponds to the average of local statistics (i.e. local version of Moran’s I). In the empirical analysis, maps of the local version of univariate Moran’s I were used to identify any significant clusters of SEP and CEP that could be characterised as either homogeneous spatial regimes (a combination of high-high or low-low attribute values among neighbouring areas as defined by the spatial weight matrix) or spatial outliers (derived from high-low or low-high spatial patterns).
Both indicators (I and Ii) were computed separately for the variables SEP2002, SEP2022 and CEP2002–2022, as they are univariate measures. In contrast, the bivariate version of the indicators allowed consideration of the spatial distribution of both variables simultaneously. In particular, the global bivariate Moran’s I defined as —measures the correlation between a variable and a spatial lag for another variable. It should be noted, however, that the index does not consider the inherent correlation between the two variables, since the bivariate spatial correlation is between and and not between and —that is to say, between two variables as the same location i. The index can be written as:
(5)
and measures the degree to which the value for a given variable at a location is correlated with its neighbours for a different variable (Anselin 2024).
The local version of the index ( ) is one of the local versions of Moran statistics proposed by Anselin and colleagues (2002). It is intended to capture the relationship between the value for one variable at location i (xi) and the average of the neighbouring values for another variable (i.e. its spatial lag: ) (Anselin 2024). According to Anselin (2024), the index can be defined as:
(6)
Apart from a constant scaling factor (that can be ignored), the index is the product of xi and the spatial lag of yi. As in the case for its global counterpart ( ), it ignores the correlation between xi and yi at location i (Anselin 2024).
In equations 5 and 6, i represents each Italian municipality, while the x and y variables are SEP2002 and CEP2002–2022, respectively; finally, are the elements of a spatial weights matrix.
For the attribution of spatial weights , we used the same approach for all four indicators ( ) – that is, a first order queen-based contiguity matrix: two territorial units (municipalities in our case) were considered neighbouring if they shared a boundary or a vertex geographically. In all spatial autocorrelation analyses, the variables were expressed in a standardised form, such that their means were zero and their variance one. The hypothesis of the existence of a condition of univariate and bivariate spatial clustering was tested at a 5 per cent level of statistical significance (p-value ≤0.05).
The thematic maps were created using QGIS Odense version 3.20.2; the spatial analysis was performed using GeoDa software version 1.14.0.
3. Ageing process in Italy: towards a multiscale comprehension of patterns and dynamics
Before presenting the results of the local analysis, it is useful to provide an overview of the ageing process that has occurred in Italy over the last 20 years using a broader geographical scale (regional and macro-regional). This analysis will allow us better to understand local dynamics, which are often quite different (and sometimes properly divergent) from the macro-ones.
3.1 The ageing process in Italy at macro-regional and regional level
Among European countries, Italy is characterised by having the oldest population (Reynaud, Miccoli 2019). The Italian population is ageing and the number of young people residing in Italy is decreasing (Caltabiano, Rosina 2018; Strozza 2023). These dynamics show important spatial differences (Schoeni, Ofstedal 2010) that are particularly relevant in Italy (Billari, Tomassini 2021; Benassi et al. 2023). These spatial differences are quite evident even at a broad geographical scale. If we divide Italy into four macro areas1 (Fig. 1), it becomes apparent that southern Italy exhibits a distinct profile compared to the other macro areas considered, particularly in terms of trends related to the percentage of older and younger population over the last two decades (2002-2022).
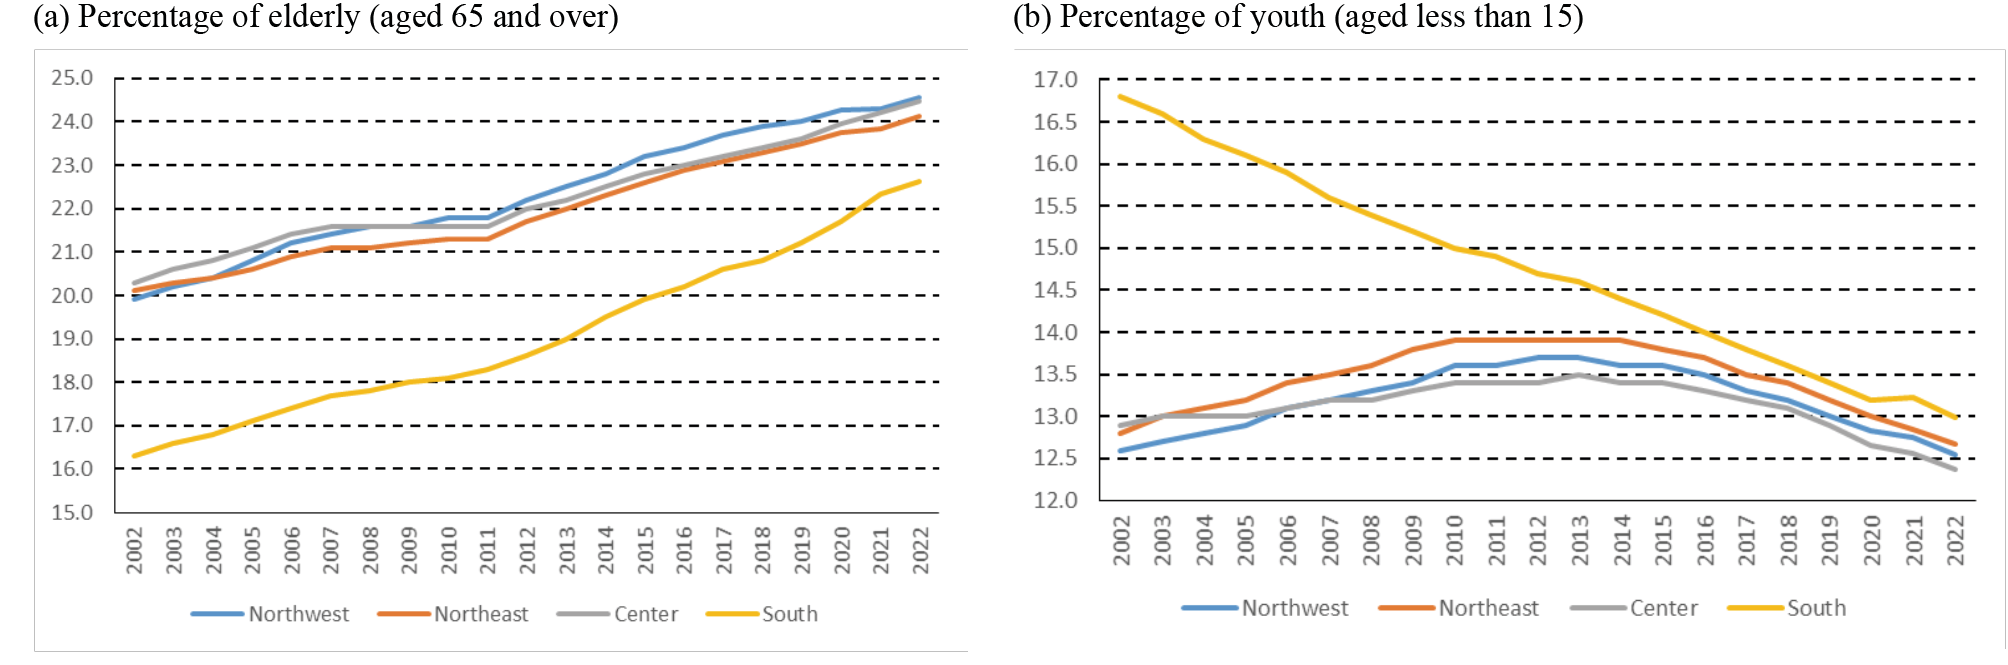
While the north-central macro areas have a very similar share of elderly residents (percentage aged 65 and over), that of southern Italy is significantly lower (as shown in Fig. 1, panel a). However, due to a combination of factors, the south has narrowed the gap with the remaining macro regions over time.2 Specifically, while in 2002 the share of elderly residents in all north-central regions was around 20 per cent, in the case of southern Italy the share dropped to 16 per cent (about 4 percentage points of difference). Twenty years later, the north-central regions have a share of the elderly around 24 per cent, while in the case of southern Italy, the figure is 22.5 per cent (about 1.5 percentage points of difference). Looking at the percentage of young people (resident population under 15 years old), two distinct geographical patterns are confirmed (Figure 1, panel b). In the south, there is a decrease in the percentage from 17 per cent to 13 per cent. In the other macro areas of Italy, in contrast, following an initial increase in the percentage during the first 10-15 years of the new millennium, there has been a decline in recent years, outlining an inverted U-shaped pattern. If we move from the level of macro geographical areas to the level of regions (Tab. 1), important heterogeneities emerge. The top five regions in 2022 by share of the elderly are Liguria, Friuli-Venezia Giulia, Umbria, Piedmont and Molise (28.9, 26.8, 26.6, 26.2 and 26.2 per cent, respectively).
| Regions | Macro regions | Percentage 65 and over |
Percentage under 15 |
||||
|---|---|---|---|---|---|---|---|
| 2002 | 2022 | Diff. | 2002 | 2022 | Diff. | ||
| Piedmont | NW | 21.3 | 26.2 | 4.9 | 12.1 | 11.9 | -0.2 |
| Aosta Valley | NW | 19.2 | 24.7 | 5.5 | 12.9 | 12.4 | -0.5 |
| Lombardy | NW | 18.2 | 23.2 | 5.0 | 13.2 | 13.1 | -0.1 |
| Trentino-Alto Adige | NE | 17.0 | 21.5 | 4.5 | 16.1 | 14.6 | -1.5 |
| Veneto | NE | 18.3 | 23.8 | 5.5 | 13.5 | 12.6 | -0.9 |
| Friuli-Venezia Giulia | NE | 21.4 | 26.8 | 5.4 | 11.5 | 11.5 | 0.0 |
| Liguria | NW | 25.6 | 28.9 | 3.3 | 10.6 | 10.8 | 0.2 |
| Emilia-Romagna | NE | 22.4 | 24.4 | 2.0 | 11.7 | 12.6 | 0.9 |
| Umbria | C | 22.8 | 26.6 | 3.8 | 12.2 | 11.9 | -0.3 |
| Tuscany | C | 22.5 | 26.1 | 3.6 | 11.7 | 11.9 | 0.2 |
| Marche | C | 21.8 | 25.7 | 3.9 | 12.9 | 12.1 | -0.8 |
| Latium | C | 18.0 | 22.8 | 4.8 | 13.8 | 12.8 | -1.0 |
| Abruzzo | S | 20.5 | 25.0 | 4.5 | 13.9 | 12.1 | -1.8 |
| Molise | S | 21.2 | 26.2 | 5.0 | 14.3 | 10.9 | -3.4 |
| Campania | S | 14.3 | 20.2 | 5.9 | 18.5 | 14.0 | -4.5 |
| Apulia | S | 15.9 | 23.4 | 7.5 | 16.7 | 12.5 | -4.2 |
| Basilicata | S | 18.6 | 24.5 | 5.9 | 15.6 | 11.5 | -4.1 |
| Calabria | S | 17.1 | 23.2 | 6.1 | 16.6 | 13.0 | -3.6 |
| Sicily | S | 16.9 | 22.6 | 5.7 | 17.1 | 13.5 | -3.6 |
| Sardinia | S | 16.1 | 25.7 | 9.6 | 13.8 | 10.7 | -3.1 |
| Italy | 18.7 | 23.8 | 5.1 | 14.2 | 12.7 | -1.5 | |
| Northwest (NW) | 19.9 | 24.6 | 4.7 | 12.6 | 12.6 | 0.0 | |
| Northeast (NE) | 20.1 | 24.1 | 4.0 | 12.8 | 12.7 | -0.1 | |
| Centre (C) | 20.3 | 24.5 | 4.2 | 12.9 | 12.4 | -0.5 | |
| South (S) | 16.3 | 22.6 | 6.3 | 16.8 | 13.0 | -3.8 | |
Molise, although a southern region, has a share of the elderly equal to Piedmont, which is a northwestern region. Also, if we look at the last three regions by share of the elderly, we observe in order (increasing in percentage) Campania, Trentino Alto Adige and Sicily. Again, two are southern regions (Campania and Sicily) and one is in the northeast (Trentino Alto Adige). In other words, while at the macro area level, two patterns, north-centre and south, are clearly distinguished, when a lower spatial detail (in this case, regions) is considered, the differences become less clear and the overall picture more complex. Compared with 2002, all Italian regions have increased the proportion of elderly people in 2022. The largest increases are concentrated in southern regions. The three largest increases are in Sardinia, Apulia and Calabria (9.6, 7.5 and 6.1 percentage point increases respectively). Only three other regions showed a non-decreasing trend in the percentage of young people (but with values very similar to 2002): Emilia-Romagna, Tuscany and Liguria. In 2022, the three regions with the highest percentages of young people were in the northeast (14.6 per cent, Trentino-Alto Adige) and in the south (Campania and Sicily with 14.0 and 13.5 per cent, respectively).
Even when looking at the three lowest percentages, both northern and southern regions are found: Molise, Liguria and Sardinia (10.9, 10.8 and 10.7 per cent respectively). These results encourage the exploration of even smaller spatial levels.
3.2 The ageing process at the local level: intensity and velocity
Analysis of the geographical distribution of the SEP and CEP (Fig. 2) allows us to focus on important spatial patterns within a general framework characterised by pronounced variability. At this level of analysis, the picture is indeed enriched with multiple nuances that are not appreciable when working on broader geographical scales (provincial or regional). While it is true that, to some extent, a certain distance between the north and the south of the country remains, it is equally true that everything becomes more complex and new territorial diversities clearly emerge. This is one of the peculiarities that characterise the local-scale analysis of demographic processes (Benassi et al. 2024).
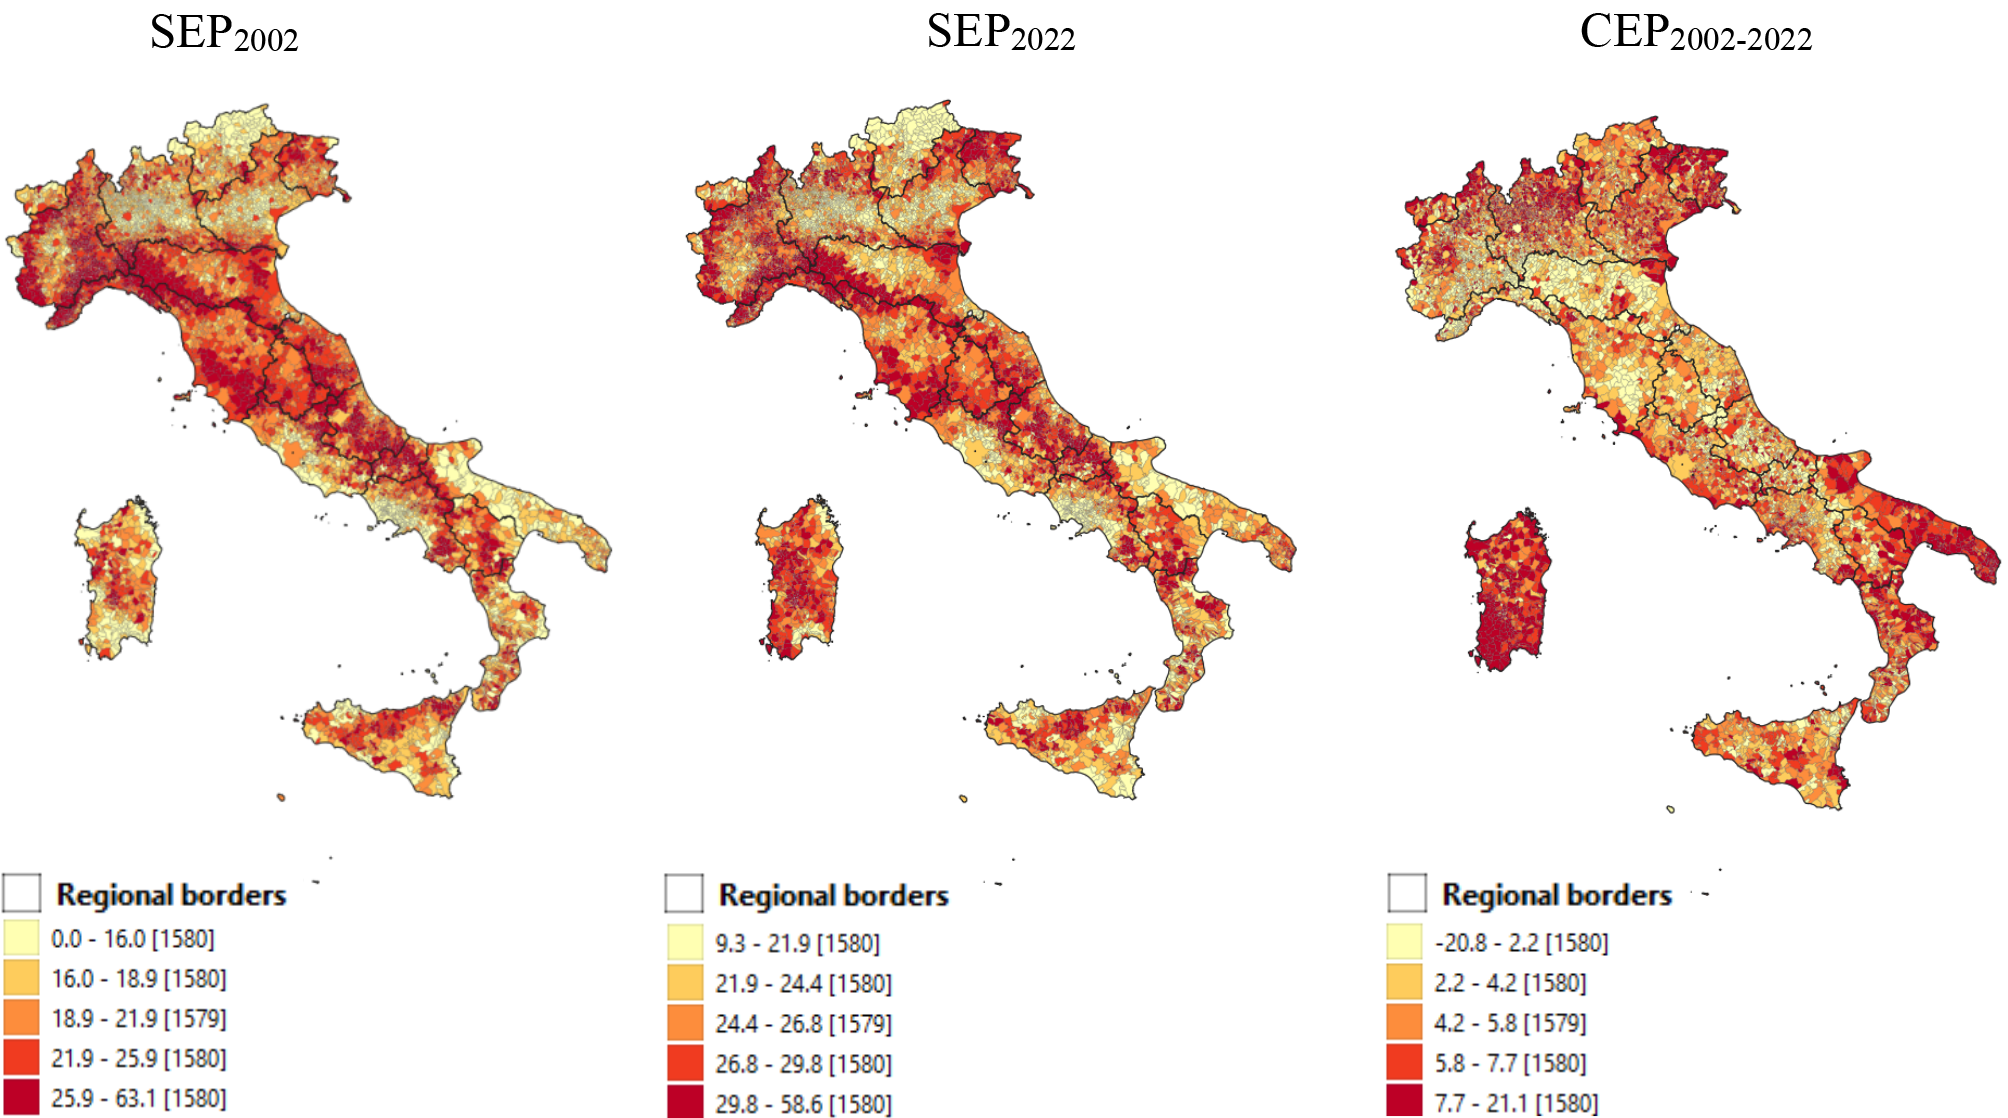
With reference to the first indicator (SEP), it seems evident that the areas falling into the last quintile (with the highest values) are significantly distributed across all regions, with a few rare exceptions found in the north (Trentino-Alto Adige, Lombardy, and to a lesser extent, Veneto), the centre (Latium) and the south (Apulia and Campania) of the country. Naturally, the drivers are presumably different, mostly related to immigration processes in the north and centre (where Rome continues to exert a certain role of attraction and redistribution of the resident population) and to fertility and short-range migration processes in the south. On the other hand, recent contributions concerning the demographic dynamics of Italian metropolitan cities (Buonomo et al. 2024) have highlighted that even at this territorial scale of analysis, the north-south dichotomy is now very blurred. What clearly emerges, always with reference to the first indicator, is that, with a few rare exceptions (such as Genoa and Turin), the large cities, whether in the south or in the centre-north, exhibit lower levels of ageing. Important distinctions emerge, though not entirely generalisable, between coastal and inland contexts. This aspect becomes more evident in certain Italian regions, such as Sardinia and, albeit in different ways, Sicily. However, high levels of ageing are observed in mountainous areas, both in the Apennines and the Alps, with the important exception of Trentino-Alto Adige, a region known for its comparatively high birth rate (Benassi et al. 2021). The map related to the speed indicator of the ageing process (CEP) at the local level presents a profile that appears in some ways to mirror the levels of the process (SEP). A preliminary graphical analysis suggests that the municipalities that recorded the most intense increase in variation (expressed in percentage points) of the elderly population from 2002 to 2022 are precisely those where the level of ageing was more contained. In fact, in the last quintile of the distribution, we find many territories that were classified in the first quintile on the previous map. Naturally, there are also cases where the reverse is true. For instance, many large cities, such as Milan, Bologna and Rome, among others, had a very contained increase in the proportion of elderly people over the period considered (they fall into the first or, at most, the second quintile) but also exhibited a relatively low final level of ageing. It is noticeable that inland Italy, particularly the Apennine regions where ageing levels were very high at the end of the period, recorded relatively contained variations in the proportion of elderly people. The opposite is easily observable in Trentino-Alto Adige, for example. A quick look at the statistical parameters in Table 2 provides a summarised view of the distributions of the two indicators.
| Indicators | Summary statistics | ||||
|---|---|---|---|---|---|
| Min | Max | Median | Mean | St. dev. | |
| SEP2002 | 0.0 | 63.1 | 20.3 | 21.3 | 6.5 |
| SEP2022 | 9.3 | 58.6 | 25.5 | 26.1 | 5.3 |
| CEP2002–2022 | -20.8 | 21.1 | 5.0 | 4.8 | 3.8 |
The Pearson correlation index, a global and non-spatial measure, between CEP and SEP (at the beginning of 2002) informs us that the level of correlation between these two dimensions of the ageing process is, as expected, negative and with a non-negligible level of intensity (-0.6). Naturally, this information cannot provide any details at the local scale, where different relationships between the two indicators could exist. This is yet another reason to analyse these relationships at the local level and with a purely spatial analysis.
3.3 The ageing process at the local level: spatial autocorrelation analysis
The analysis of global and local spatial autocorrelation allows us to measure the level of spatial clustering of the intensity and velocity of population ageing and to identify local clusters where the distribution of each indicator (univariate) or both indicators (bivariate) is not random. Essentially, it allows us to verify empirically the idea underlying the first law of geography, namely that everything is connected to everything else, but things that are closer together are more connected than those that are far apart (Tobler 1970). Among the two indicators, the SEP records the highest level of positive clustering, albeit decreasing from 2002 to 2022: 0.66 and 0.61, respectively, for a theoretical maximum value of 1. The positive sign means that similar values (high or low) tend to cluster in the territory, forming, in the first case, clusters of the high-high (HH) type and, in the second, clusters of the low-low (LL) type. These are essentially hot and cold spots. Spatial outliers, on the other hand, are cases of negative spatial autocorrelation – i.e. LH and HL – which, as we can see from the map in Figure 3, are ultimately a residual set compared to the first two types.
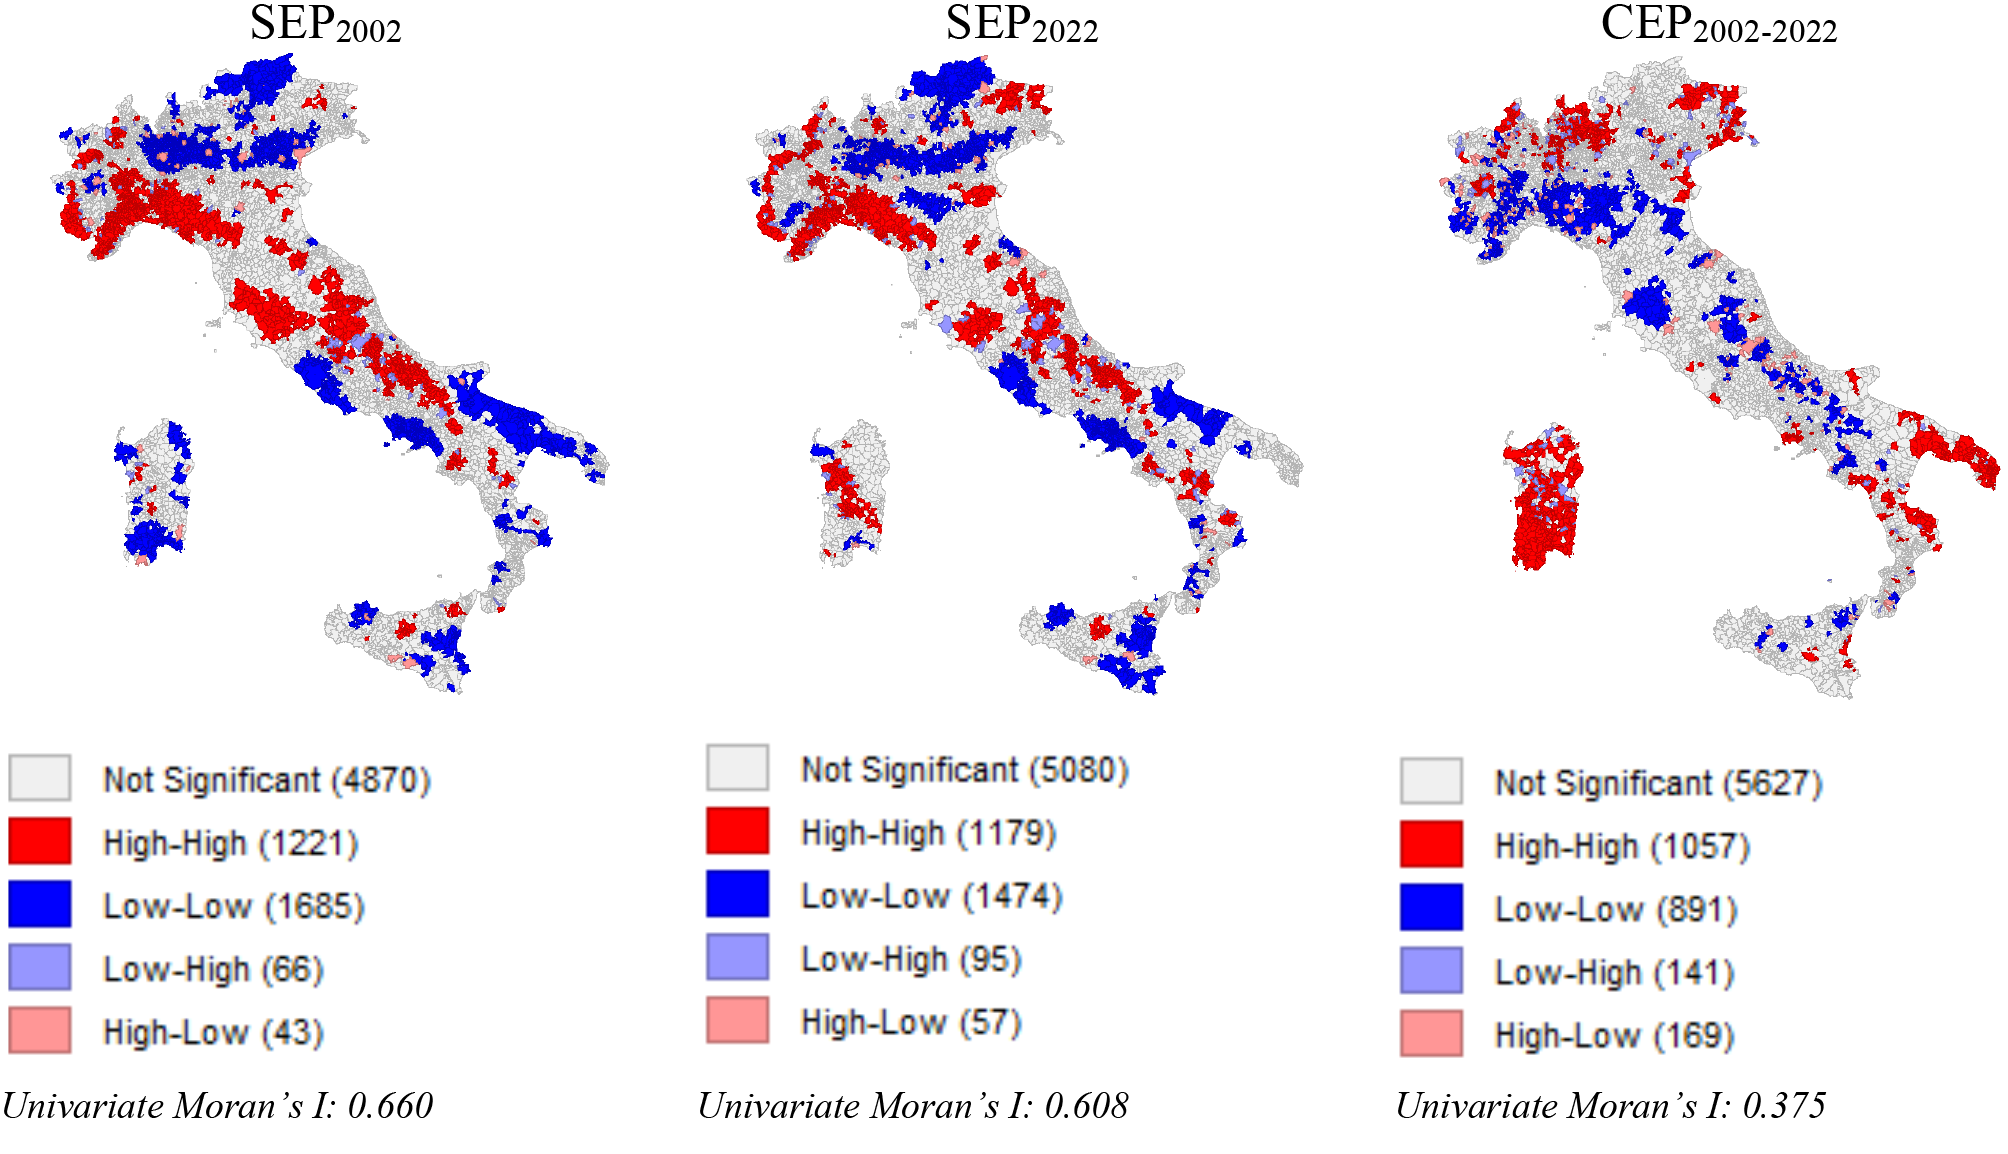
The distribution of clusters (HH and LL) related to the SEP index shows how clusters of high values are recorded not only in the inland areas of Italy as expected, especially along the Apennine ridge and in the interior of Sardinia, but also in some other more urbanised and, in some cases, metropolitan areas. This is the case in Liguria, where even Genoa falls within an HH cluster, but also in Turin and its interior, and part of Emilia-Romagna. On the other hand, areas affected by LL clustering situations include both urban contexts – most metropolitan cities in both the south and the north – as well as rural and even mountainous areas (such as in Trentino-Alto Adige). There is also a dense band of high infrastructure and anthropic density that extends from Veneto horizontally across Italy to Lombardy, creating a compact cluster of territories characterised by low indicator values. Similar situations are found in Apulia, Campania (especially around Naples), Latium and Emilia-Romagna. It is also interesting to note (for 2022) a case of HL negative spatial autocorrelation concerning the metropolitan city of Cagliari, where suburbanisation processes driven by centrifugal migrations and rural-to-(sub)urban migrations result in the central municipality having a high indicator value and the surrounding municipalities low values.
This mosaic of spatial relationships becomes richer when we look at the map of the indicator related to the speed of the ageing process (CEP). The global clustering level, although lower than that of the SEP, is still appreciable: 0.375. Particularly interesting in this case, too, is the analysis of the geographic distribution of local clusters. Once again, the local dimension emerges without showing a clear north-south pattern or an urban-rural dichotomy. Such conditions occur in some cases, while in others they do not, making the local fabric of spatial relationships particularly varied. Indeed, it is true that HH clusters are highly concentrated in Sardinia, where urban and rural areas do not seem to differ as in other southern regions (Apulia, Calabria, Campania, although with less intensity and more modest spread); it is equally true that clusters of the same type are found not only in some Alpine areas along the national borders but also in urban areas. A distinctive feature of this indicator is what happens precisely in the metropolitan cities of the north, particularly in Venice, Milan and Turin, where a negative spatial autocorrelation of the LH type distinguishes the centre from the periphery. This does not occur in the metropolitan municipalities of the south, or at least only in some of them, such as in Naples, which, along with its neighbouring municipalities, belongs to the HH cluster, as does Cagliari. Finally, it is interesting to note how, in the remaining metropolitan municipalities, the distribution of this indicator is random and does not present statistically significant clustering levels.
The analysis of spatial relationships between the two indicators allows us to understand further aspects. For the sake of clarity, the bivariate analysis is related to the SEP at the beginning of 2002 and the CEP. At the global (spatial) level, a non-negligible and statistically significant negative bivariate correlation is observed, given that the value of the bivariate Moran’s index is -0.33. In other words, low levels of the (initial) ageing index (intensity, SEP) are spatially correlated with high values of ageing speed (CEP). The Moran’s I local decomposition provides us with much more information that aligns well with the general purpose of the paper, which is to provide an initial reflection on the complexity of spatial ageing relationships measured on a local scale (Fig. 4). The main result in this case is that the number of clusters indicative of a negative spatial relationship (LH and HL) significantly increases, and the LH cluster type is now the most numerous (906), followed by the HL cluster type (900). In both cases, an inverse (spatial) relationship exists between the intensity and velocity of the ageing process. This fits with our initial hypothesis.
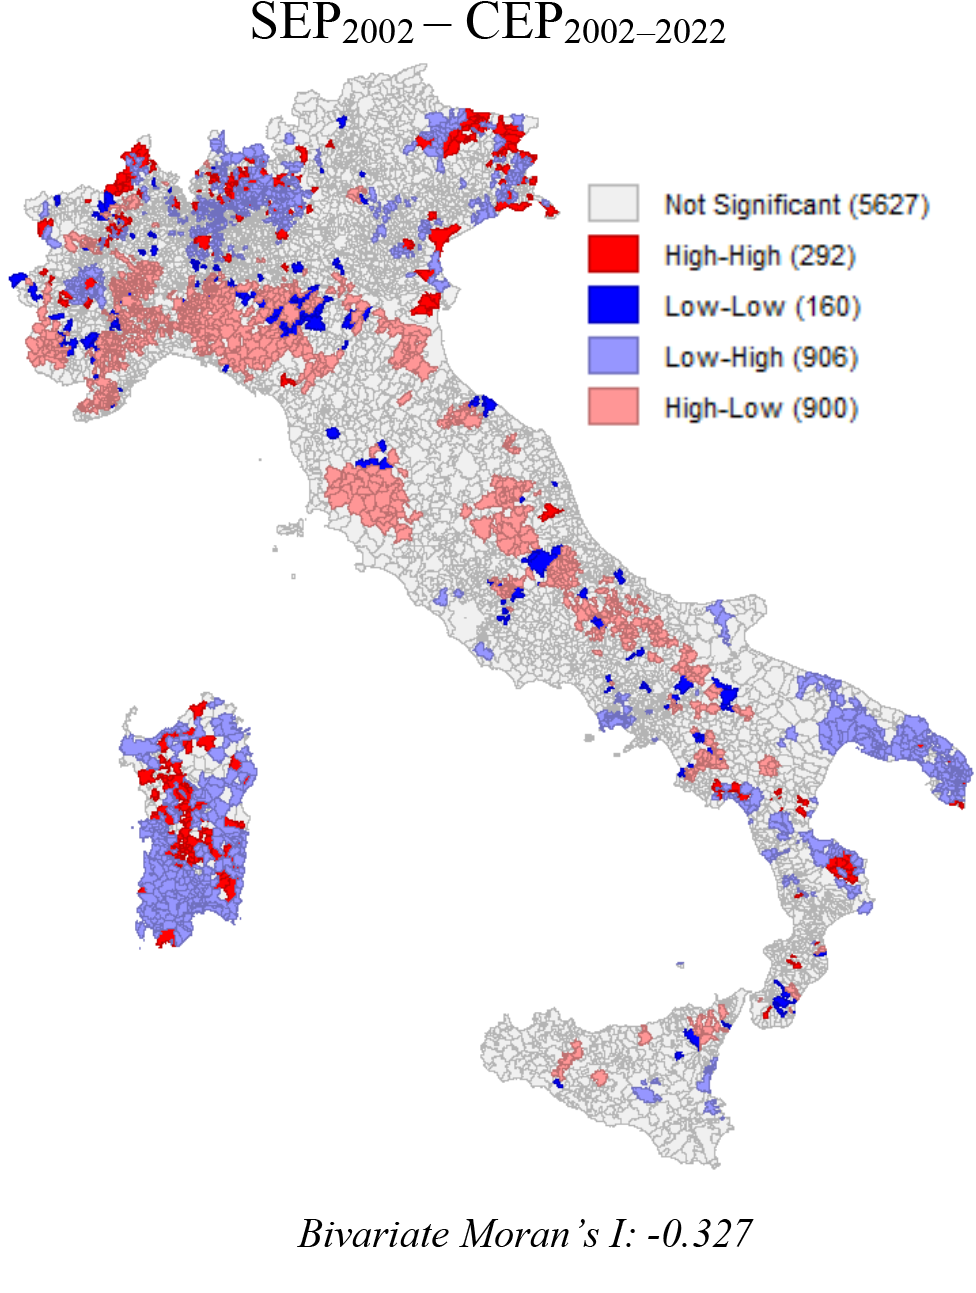
Many municipalities placed in the surrounding areas of the main metropolitan northern cities (Turin, Milan and Venice) are classified in HL clusters, proving the effect of the suburbanisation process towards the skirt of the urban fabric because of young families and immigrant populations. In the same cluster, some metropolitan municipalities of southern Italy are classified, like Naples, Cagliari and Catania. With few exceptions, in the other large cities and generally more urbanised areas, the spatial relationship between the two indicators is not spatially correlated. This also happens in many urban areas of Sardinia, such as the areas of Alghero and Olbia, and generally the coastal areas of the island. The HL cluster, on the other hand, mainly involves geographically isolated municipalities, which are mostly found in continental northern Italy, with a marked prevalence in the northwest (especially Liguria, Emilia and Piedmont), in the centre (particularly in the southern areas of Tuscany, but not exclusively), and in the south (mountainous and inland areas).
4. Discussion and conclusions
The empirical analysis has allowed us to acquire new evidence on the ageing process in Italy over the last twenty years and to appreciate its rich local heterogeneities. The importance of the scale of analysis in studying population processes, including ageing, is a topic of absolute relevance (Howell et al. 2016), especially because, as widely demonstrated, what we observe at a macro level often results from highly differentiated and sometimes divergent local dynamics (Salvati et al. 2020). In this perspective, the classic north-south and urban-rural dichotomies, which have guided the analysis of many important demographic studies (Barsotti, Bonaguidi 1981; Vitali 1983; Bonaguidi 1985; Casacchia et al. 2005), seem to have given way to a much more granular and heterogeneous reality where, without adequate knowledge of the observed processes and the methodologies of spatial analysis, it is easy to get lost. Demography, not unlike many other social sciences, has been able to take advantage of the spatial revolution that lies in the diffusion of geographic information systems and the increasing availability of geo-referenced databases (Matthews, Parker 2013). This has allowed the development of a set of studies that meet the need, and urgency, to produce information and knowledge of processes at an adequate geographical scale to be able to formulate place-based policies (Fotheringham, Sachdeva 2022; Benassi et al. 2024). This is a fundamental aspect that cannot be overlooked.
As is evident from what has been seen in the contribution, ageing, not unlike other demographic phenomena, assumes multiple and varied spatial configurations at a local level. In the last twenty years, these configurations have contributed to the consolidation of some patterns that seem to emerge clearly from our exploratory analysis. The ageing levels (SEP) at the end of the period (2022) inform us about a largely aged territory with a mean value of 26.1 per cent for the indicator (21.3 per cent in 2002) that nevertheless presents considerable variability (from less than 10 per cent to just under 60 per cent).3 This variability, as mentioned, only partially reflects what some may define as the classic geographies of ageing. Not all mountainous areas – often associated with concepts such as isolation and marginality, for example – are highly aged, just as not all cities – often associated instead with concepts of migratory attraction and greater dynamism – are less aged. The analysis of global and especially local autocorrelation informs us of this aspect in a precise manner. Indeed, while SEP is spatially dependent (Moran’s I decreases from 2002 to 2022 but remains higher than 0.6) and thus affected by a considerable degree of clustering, it is equally true that clusters of high (HH) and low (LL) values are distributed throughout the national territory, showing that it is the local conditions, and not the meso or macro ones, that define the geographies. Even the indicator related to the speed of ageing (CEP), which also presents significant variability in distribution, ranging from -20.1 percentage points to 21.1 percentage points for a mean value of 4.8, seems to confirm that local conditions prevail over macro patterns. In this case, the level of positive global clustering is lower than in the previous case (0.37), but it is still significant. The local dimension of this clustering outlines a highly heterogeneous territory where multiple conditions of high and low speed exist, and where, once again, clear patterns regarding the classic dichotomies (coastal-inner areas, urban-rural areas, northern-southern areas) do not seem to emerge.
On the other hand, the combined analysis of the two indicators (SEP2002 and CEP2002–2022) has shown how, at a spatial level, an inverse relationship exists (-0.327). Once again, the local decomposition of the global indicator has allowed us to appreciate some peculiar aspects. The inverse relationship exists and is statistically significant in a considerable number of municipalities (1,806 – that is to say, about 23 per cent of Italian municipalities), proving that our hypothesis was correct. From 2002 to 2022, a sort of diffusion (or convergence) of the ageing process has occurred in Italy, so that municipalities that recorded higher levels of ageing in 2002 have recorded lower velocity of that process. This is also confirmed by the Pearson correlation coefficient (-0.6). What is important to note is that this process is distributed in a very uneven manner and, once again, according to spatial patterns that are essentially micro. A word of caution regarding the formation of clusters seems necessary. Indeed, we cannot exclude the possibility that chance played a role in their formation. This is because, as studied by Salinari and De Santis (2009), we cannot rule out the possibility that, at least for some municipalities, the distribution of elderly individuals may follow a random process.
The findings of this study provide a detailed look at the uneven pace of ageing across Italy, revealing significant spatial heterogeneities with profound societal implications. Regions in the south, traditionally characterised by younger populations, are now experiencing a marked acceleration in ageing, while northern regions are already advanced in the ageing process. These regional differences point to a growing challenge for policymakers, who must navigate not only the rising demand for healthcare and social services but also the economic consequences of a shrinking working-age population. As younger generations leave rural or economically stagnant areas, the burden of care increasingly falls on formal institutions, eroding the traditional family-based support systems that once sustained elderly care (Sundström 1994; Lesthaeghe 2010; Grundy, Murphy 2017). This transformation necessitates a shift in policy, focusing on the development of age-friendly infrastructure and community-based support networks, particularly in areas where ageing is more pronounced. Equally important is the need to address labour market shortages caused by demographic imbalances. The spatial heterogeneities revealed in this study highlight the limitations of uniform policymaking when addressing the complex challenges of population ageing. Instead, a place-based strategy that considers the specific demographic and economic conditions of each region is required to mitigate the wide-ranging impacts of ageing. By leveraging localised data, policymakers can better anticipate the future needs of ageing populations and develop targeted interventions that promote both social and economic resilience. As the Italian population continues to age, these findings offer a crucial roadmap for responding to one of the most significant demographic shifts of our time.
Future steps, already partly undertaken, should involve the multiscale modelling of SEP and CEP through specific models such as multiscale geographically weighted regression model (Oshan et al. 2019), capable of estimating the local drivers of ageing intensity and speed with a multiscale approach. The idea is to retain as much information as possible in both input variables and output estimates to evaluate how different local heterogeneities impact processes that act on a global scale but are spatially micro-founded. This is something that has been widely demonstrated, also in relation to Italy, by studies of business demography in which the reactivity of individual companies to the foreign economic cycle, measured by a specific sensitivity indicator, has been studied at the meso level in relation to individual local labour systems, studying their clustering level. The results in that case, too, showed how each territory reacts differently, drawing patterns that are highly variable and fragmenting (Armenise et al. 2022). We believe that (human) demography can and should move in this direction to be a necessary (and useful) science for the governance of places and territories.
Aknowledgements
The contribution is as part of the PRIN 2022-PNRR research project “Foreign population and territory: integration processes, demographic imbalances, challenges and opportunities for the social and economic sustainability of the different local contexts (For.Pop.Ter)” [P2022WNLM7]. Funded by European Union—Next Generation EU, component M4C2, Investment 1.1. We also acknowledge co-funding from Next Generation EU, in the context of the National Recovery and Resilience Plan, Investment PE8 – Project Age-It: "Ageing Well in an Ageing Society". This resource was co-financed by the Next Generation EU [DM 1557 11.10.2022]. The views and opinions expressed are only those of the authors and do not necessarily reflect those of the European Union or the European Commission. Neither the European Union nor the European Commission can be held responsible for them.
References
Anselin, L. (1995). Local indicators of spatial association-LISA. Geographical Analysis, 27, 93-115. https://doi.org/10.1111/j.1538-4632.1995.tb00338.x
Anselin, L. (2024). An Introduction to Spatial Data Science with GeoDa. Volume 1: Exploring Spatial Data. Boca Raton, Florida, CRC/Chapman and Hall.
Anselin, L., Syabri, I., Smirnov, O. (2002). Visualizing multivariate spatial correlation with dynamically linked windows. In Anselin, L., Rey, S. (eds.). New Tools for Spatial Data Analysis: Proceedings of the Specialist Meeting. University of California, Santa Barbara, Center for Spatially Integrated Social Sciences (CSISS).
Armenise, M., Benassi, F., D’Elia, M., Mantuano, M., Petrei, F. (2022). The exposure geography of Italian local economies to major foreign ones. Evidences from a multiscale spatial experiment based on granularity. Jahrbücher für Nationalökonomie und Statistik, 242(1), 87-105. https://doi.org/10.1515/jbnst-2020-0064
Barsotti, O., Bonaguidi, A. (1981). Le trasformazioni dei modelli territoriali di sviluppo demografico in Italia. Roma, Carucci.
Benassi, F., Busetta, A., Gallo, G., Stranges, M. (2021). Le diseguaglianze tra territori. In Billari, F.C., Tomassini, C. (eds.). Rapporto sulla popolazione. L’Italia e le sfide della demografia. Bologna, Il Mulino, 135-161.
Benassi, F., Busetta, A., Gallo, G., Stranges, M. (2023). Neighbourhood effects and determinants of population changes in Italy: A spatial perspective. Vienna Yearbook of Population Research, 21, 311-338. https://doi.org/10.1553/p-5dfz-c44a
Benassi, F., Carella, M. (2023). Modelling geographical variations in fertility and population density of Italian and foreign populations at the local scale: A spatial Durbin approach for Italy (2002-2018). Quality and Quantity, 57, 2147-2164. https://doi.org/10.1007/s11135-022-01446-1
Benassi, F., Tomassini, C., Lallo, C. (2024). The local regression approach as tool to improve place-based policies: the case of Molise (Southern Italy). Spatial Demography, 12(2), 1-28. https://doi.org/10.1007/s40980-024-00123-1
Bengtsson, T. (2001). Mortality: The great historical decline. In Smelser, N.J., Yates, P.B. (eds.). International Encyclopedia of the Social & Behavioral Sciences. Oxford: Pergamon, 10079-10085. https://doi.org/10.1016/B0-08-043076-7/02116-1
Bengtsson, T., Scott, K. (2010). The Ageing Population. In Bengtsson, T. (eds.). Population Ageing - A Threat to the Welfare State? Demographic Research Monographs. Springer, Berlin, Heidelberg, 7-22.
Billari, F.C., Tomassini, C. (eds., 2021). Rapporto sulla popolazione. L’Italia e le sfide della demografia. Bologna, Il Mulino.
Bonaguidi, A. (1985). Migrazioni e demografia regionale in Italia. Milano, Franco Angeli.
Buonomo, A., Benassi, F., Gallo, G., Salvati, L., Strozza, S. (2024). In-between centers and suburbs? Increasing differentials in recent demographic dynamics of Italian metropolitan cities. Genus, 80(1). https://doi.org/10.1186/s41118-023-00209-6
Caltabiano, M., Rosina, A. (2018). The dejuvenation of the Italian population. Journal of Modern Italian Studies, 23(1), 24-40. https://doi.org/10.1080/1354571X.2017.1409527
Casacchia, O., Cangiano, A., Conti, C., Di Cesare, M., Iacoucci, R., Vittori, P. (2005). Population prospects and problems of Italian regions. Genus, 61(3-4), 495-538. https://doi.org/10.2307/29789285
Channer, N.S., Hartt, M., Biglieri, S. (2020). Aging-in-place and the spatial distribution of older adult vulnerability in Canada. Applied Geography, 125. https://doi.org/10.1016/j.apgeog.2020.102357
Chesnais, J.C. (1990). Demographic transition patterns and their impact on the age structure. Population and Development Review, 16, 327-336.
Clark, G. (2007). A Farewell to Alms: A Brief Economic History of the World. Princeton (NJ), Princeton University Press.
Coale, A.J. (1956). The effects of changes in mortality and fertility on age composition. The Milbank Memorial Fund Quarterly, 34(1), 79-114.
De Castro, M.C. (2007). Spatial demography: An opportunity to improve policy making at diverse decision levels. Population Research and Policy Review, 26(5), 477-509. https://doi.org/10.1007/s11113-007-9041-x
Eurostat. (2023). Eurostat Regional Yearbook—2023 Edition, viewed 12 June 2024, https://ec.europa.eu/eurostat/web/products-flagship-publications/w/ks-ha-23-001
Fotheringham, A.S., Sachdeva, M. (2022). On the importance of thinking locally for statistics and society. Spatial Statistics, 50, 100601. https://doi.org/10.1016/j.spasta.2022.100601
Galeano, J., Bayona-i-Carrasco, J. (2018). Residential segregation and clustering dynamics of migrants in the metropolitan area of Barcelona: A demo-spatial analysis at the census tract level. Quetelet Journal, 6(1), 99-127.
Gortfelder, M., Jaadla, H. (2023). Determinants of fertility during the fertility transition in Estonia: A spatial analysis. Spatial Demography, 11, 5. https://doi.org/10.1007/s40980-023-00116-6
Grundy, E.M., Murphy, M. (2017). Population ageing in Europe. In Michel, J.P., Beattie, L.B., Martin, F.C., Walston, J.D. (eds.). Oxford Textbook of Geriatric Medicine. Oxford, Oxford University Press, 11-17.
Howell, F.M., Porter, J.R., Matthews, S.A. (2016). Recapturing Space: New Middle-Range Theory in Spatial Demography. Berlin, Springer.
Káčerová, M., Ondačková, J., Mládek, J. (2014). Time-space differences of population ageing in Europe. Hungarian Geographical Bulletin, 63(2), 177-199. https://doi.org/10.15201/hungeobull.63.2.4
Kohler, H.P., Billari, F.C., Ortega, J.A. (2002). The emergence of lowest‐low fertility in Europe during the 1990s. Population and Development Review, 28(4), 641-680. https://doi.org/10.1111/j.1728-4457.2002.00641.x
Künemund, H., Kolland, F. (2007). Work and retirement. In Bond, J., Peace, F., Dittmann-Kohli, F., Westerhof, G. (eds.). Ageing in Society. London, Sage, 176-185.
Lesthaeghe, R. (2010). The unfolding story of the second demographic transition. Population and Development Review, 36(2), 211-251. https://doi.org/10.1111/j.1728-4457.2010.00328.x
Lesthaeghe, R., Lopez-Gay, A. (2013). Spatial continuities and discontinuities in two successive demographic transitions: Spain and Belgium, 1880-2010. Demographic Research, 28, 77-136. https://doi.org/10.4054/DemRes.2013.28.4
Longman, P. (2004). The Empty Cradle: How Falling Birthrates Threaten World Prosperity and What to Do About It. New York, NY, Basic Books.
Matthews, S.A., Parker, D.M. (2013). Progress in spatial demography. Demographic Research, 28, 271-312. https://doi.org/10.4054/DemRes.2013.28.10
Moran, P.A.P. (1948). The interpretation of statistical maps. Journal of The Royal Statistical Society, 10(2), 243-251.
Nicolini, R., Roig, J.L. (2024). The spatial dimension of ageing and growth in European regions. The Annals of Regional Science, 73, 1-31. https://doi.org/10.1007/s00168-024-01311-z
OECD (2006). Live Longer, Work Longer, Ageing and Employment Policies. Paris, OECD Publishing.
Oshan, T.M., Li, Z., Kang, W., Wolf, L.J., Fotheringham, A.S. (2019). mgwr: A Python implementation of multiscale geographically weighted regression for investigating process spatial heterogeneity and scale. ISPRS International Journal of Geo-Information, 8(6), 269. https://doi.org/10.3390/ijgi8060269
Plane, D.A. (2012). What about aging in regional science? The Annals of Regional Science, 48, 469-483. https://doi.org/10.1007/s00168-011-0493-x
Plouffe, L., Kalache, A. (2010). Towards global age-friendly cities: Determining urban features that promote active aging. Journal of Urban Health, 87(5), 733-739. https://doi.org/10.1007/s11524-010-9466-0
Preston, S.H., Stokes, A. (2012). Sources of population aging in more and less developed countries. Population and Development Review, 38(2), 221-236. https://doi.org/10.1111/j.1728-4457.2012.00490.x
Reher, D.S. (2015). Baby booms, busts, and population ageing in the developed world. Population Studies, 69(sup1), S57-S68. https://doi.org/10.1080/00324728.2014.963421
Reynaud, C., Miccoli, S. (2019). Population ageing in Italy after the 2008 economic crisis: A demographic approach. Futures, 105, 17-26. https://doi.org/10.1016/j.futures.2018.07.011
Reynaud, C., Miccoli, S., Lagona, F. (2018). Population ageing in Italy: An empirical analysis of change in the ageing index across space and time. Spatial Demography, 6(3), 235-251. https://doi.org/10.1007/s40980-018-0043-6
Salinari, G., De Santis, G. (2009). Evoluzione del popolamento e casualità: Italia 1991-2002, Toscana 1820-2000. In Macchi Jánica, G. (Ed.). Geografie del popolamento. Casi di studio, metodi e teorie. Siena, Edizioni dell’Università, 176-186.
Salvati, L., Benassi, F., Miccoli, S., Rabiei-Dastjerdi, H., Matthews, S.A. (2020). Spatial variability of total fertility rate and crude birth rate in a low-fertility country: Patterns and trends in regional and local scale heterogeneities across Italy, 2002-2018. Applied Geography, 124. https://doi.org/10.1016/j.apgeog.2020.102321
Schoeni, R.F., Ofstedal, M.B. (2010). Key themes in research on the demography of aging. Demography, 47(1), S5-S15. https://doi.org/10.1353/dem.2010.0001
Strozza, S. (2023). La crisi demografica italiana nel contesto europeo. Cause e possibili soluzioni. Bancaria, 79(12), 2-9.
Strozza, S., De Santis, G. (eds., 2017). Rapporto sulla popolazione. Le molte facce della presenza straniera in Italia. Bologna, Il Mulino.
Sundström, G. (1994). Care by families: An overview of trends. In OECD (Ed.). Caring for Frail Elderly People. New Directions in Care. OECD Social Policy Studies 14, 15-55.
Tobler, W.R. (1970). A computer movie simulating urban growth in the Detroit region. Economic Geography, 46(1), 234-240. https://doi.org/10.1080/1369183X.2010.515132
van Nimwegen, N., van der Erf, R. (2010). Europe at the crossroads: Demographic challenges and international migration. Journal of Ethnic and Migration Studies, 36(9), 1359-1379.
Vitali, O. (1983). L’evoluzione rurale-urbana in Italia: 1951–1977. Milano, Franco Angeli.
Voss, P.R. (2007). Demography as a spatial social science. Population Research and Policy Review, 26(5), 457-476. https://doi.org/10.1007/s11113-007-9047-4
Wrigley, E.A., Schofield, R.S. (1989). The Population History of England 1541–1871. Cambridge, Cambridge University Press.
1 Please note that the south includes the regions of Sardinia and Sicily.
2 The south of Italy has narrowed the gap with the northern and central macro-regions due to several factors. These include demographic changes, such as declining fertility rates and an ageing population, which are increasingly aligning with trends in the north. Additionally, migration patterns, particularly the out-migration of younger individuals from the south, have played a role. The slower but steady decline in mortality rates has also contributed to this convergence, gradually reshaping the demographic profile of southern regions to resemble that of the north (Strozza, De Santis 2017).