https://doi.org/10.36253/bsgi-7530
Towards the Identification of a Systemic Depopulation Areas Index: the Case of Molise
Verso l’identificazione di un indice delle aree di spopolamento sistemico: il caso del Molise
1 Dipartimento di Economia, Università degli Studi del Molise, Italia
2 Dipartimento di Scienze Politiche, Università degli Studi di Napoli “Federico II”, Italia
E-mail: carlo.lallo@unimol.it; federico.benassi@unina.it; cecilia.tomassini@unimol.it
Abstract. Southern European populations are shrinking and ageing. Concerns about the negative impact of significant population decline on Europe’s future economic development and social cohesion are increasingly featured in official documents and public debates. Recent studies agree that the current population decline in developed countries is a systemic process, path-dependent, self-sustaining and geographically heterogeneous, with a strong degree of inertia. This paper introduces a meaningful and straightforward index – the Systemic Depopulation Areas Index (SyDAs) – easily replicable and updatable, designed to identify the presence or absence of a systemic depopulation process at the local level, using time series analysis. The new index was tested over the period 2002-2021 on the municipalities of a region in southern Italy: Molise. This index could be a useful tool for evaluating the effectiveness of future policies, such as the SNAI (National Strategy for “Inner Areas”) and the Recovery and Resilience Plan (RRP), (Next Generation EU) by capturing reversal in depopulation processes at the local level. The results reveal a potential mismatch at local level between the geographical areas targeted by policy interventions and those most in need of intervention to halt population decline.
Keywords: systemic depopulation, time series analysis, local demography, marginal areas, Molise.
Riassunto. Le popolazioni dell’Europa meridionale stanno diminuendo ed invecchiando. Gli effetti negativi di una grave contrazione demografica sullo sviluppo economico e sulla coesione sociale dell’Europa sono sempre più al centro nei documenti ufficiali e nei dibattiti politici. Studi recenti concordano sulla natura sistemica dello spopolamento, inserito in un sentiero di decrescita, autoalimentato e geograficamente eterogeneo, con un alto grado di inerzia. In questo articolo è descritta una proposta per un indice binario semplice e trasparente, facilmente replicabile e aggiornabile, in grado di identificare l’esistenza/assenza di un processo di spopolamento sistemico a livello locale, utilizzando l’analisi delle serie temporali: l’indice delle Aree a Spopolamento Sistemico (Systemic Depopulation Areas – SyDAs). Il nuovo indice, testato nel periodo 2002-2021 sui comuni della regione Molise, potrebbe rivelarsi utile per valutare la futura efficacia di politiche come la SNAI (Strategia Nazionale per le Aree Interne) ed il PNRR (Next Generation EU), catturando le prime inversioni nei processi di spopolamento a livello locale. Inoltre, il SyDAs evidenzia una discrepanza tra le aree di intervento e le aree più esposte al declino sistemico.
Parole chiave: spopolamento sistemico, analisi delle serie storiche, demografia locale, aree interne, Molise
Contents
2. Systemic depopulation: background and measures
1. Introduction
Southern Europe’s population is shrinking1 and over-ageing2, reversing the traditional age pyramid. Between 2014 and 2022, the Southern European countries3 lost approximately 1.3 million people and the share of people aged 65 and over increased from 20% to 22%. Baseline projections indicate a continued decline, with the population expected to decrease by about 7.1 million by 2065. During the same period, the share of those aged 65 and over is projected to climb to 33%.
The process started in the mid-1990s of the last century and has been accelerating ever since. Many studies have long been sounding the alarm about an approaching “demographic winter” (Lallo, Tomassini 2023; Franklin 2020, 2019; Coleman and Rowthorne 2011; Kohler et al. 2002; Golini 1997; Demeny 1997; Sauvy 1949; 1957). Concerns about the negative impact of severe population decline on Europe’s future economic and social development are increasingly featured in official documents, debates and policy planning in supranational organisations such as the United Nations (UN) and the European Union (EU) (e.g. UNFPA 2023; EU Parliament 2021; EESC 2020). In many national and local contexts, depopulation is already a key issue on the political agenda, especially in relation to urban-rural and regional imbalances (Italian Presidency of the Council of Ministers 2023; Barca, Carrosio 2020; Barca 2015; Barca et al. 2014).
However, despite growing concerns, implemented policies, and the prominence of the issue in public debates, the process of population decline is far from being resolved and may not be slowing down anytime soon. This discrepancy between the growing attention on the scientific and political agenda and the minimal impact on the demographic process can be attributed to two main reasons. First, population decline is both an outcome and a process, in a self-sustaining cycle with a significant inertia (Newsham, Rowe 2022; Franklin 2020; Benassi et al. 2023a; Reynaud et al. 2020; Elshof 2014). The window of opportunity to prevent this cycle from taking hold and to reverse its trajectory was lost many years ago. The effects of policies implemented today to counteract depopulation processes are likely to have their first significant effects in the medium term provided they remain consistent enough, like a long-term investment (Sobotka et al. 2019). However, ensuring the stability and continuity of such policies could be very difficult in a political context of rapid change and short evaluation periods. A new tool designed to promptly capture signals of a slowdown in the contraction process of the population could help to maintain the path, or to make some changes when necessary.
Second, the geography of depopulation, administrative boundaries and policy objectives do not necessarily overlap. Local administrative units are usually both the beneficiaries, and the final implementers of policies designed at local/regional/national/supranational level. This presents two sets of problems: geographical heterogeneity and administrative heterogeneity.
The population is not homogeneously distributed within a regional and local administrative unit (Reynaud, Miccoli 2018; Reynaud et al. 2020; Zambon et al. 2019), particularly when these units are situated in mountainous areas or in regions that encompass both mountainous and coastal zones—a scenario not uncommon in countries like Italy or Greece. If a policy is formulated at the national level and target areas are selected based on average indicators derived from robust but less sensitive statistical measures, it may result in an inefficient allocation of resources. A statistical measure designed to be objective, straightforward and locally observable, without imposing additional burdens on local government, could provide a standardised approach in measuring the depopulation process at the local level.
This paper proposes a first attempt to design such a tool, starting from the concept of systemic depopulation. The background section (2) describes a view of depopulation in Europe, focusing on Southern Europe, with the most recent evidence, approaches and measures developed to analyse the process. The following section (3) focuses on Molise, a small region located in southern Italy, which is the case study. This section will justify this choice in terms of its demographic history, geomorphological characteristics and the current state of policy implementation.
The fourth section introduces a proposal for measuring systemic depopulation in local areas, specifically designed to monitor the impact of policies aimed at reversing this process: the Systemic Depopulation Areas (SyDAs) index. The results of this index are analyzed and discussed in section 5 (Results and Discussion). Lastly, section 6 presents some initial conclusions.
2. Systemic depopulation: background and measures
Some of the earliest considerations and concerns regarding European depopulation and the ageing process were probably articulated by Alfred Sauvy and David Victor Glass in the mid-20th century (Sauvy 1949; 1957; Glass 1940). These scholars observed the initial significant decline in fertility rates in Europe and North America, but this issue, along with associated concerns, receded from the agendas of both scientific and political discourse until the late 1980s.
Dirk Van de Kaa (1987) and Paul Demeny (1997) were among the first demographers to reemphasize the focus on low fertility in Europe and the related depopulation issue. Indeed, the emergence of exceptionally low fertility rates in southern Europe in the 1990s led some authors (Kohler et al., 2002) to propose a new definition: “lowest-low” fertility, referring to countries with fertility rates below 1.5 births per woman. The interaction between lowest-low fertility and the age structure of the population has also become an important factor in the decline of new birth cohorts, contributing to depopulation. If fertility rates remain below the replacement level for an extended period, approximately 30 years, the progressive reduction of younger and adult cohorts contributes to depopulation, thereby reducing the demographic base for future births (Goldstein et al. 2004).
Moreover, out-migration has emerged as a pivotal catalyst for depopulation at the local level, particularly in Southern and Eastern Europe. This dynamic has amplified the effects of low fertility, creating a vicious cycle in which depopulation leads to reduced economic growth and a contraction in public services, thereby triggering further emigration (Martins, Davino 2023; Alamá-Sabater et al. 2021; Lutz, Gailey 2020; Reynaud et al. 2020; Franklin 2020; Christiaans 2017; Ubarevičienė, van Ham 2017). For instance, examining the regions (NUTS 2 level) of Southern Europe (comprising Italy, Spain, Portugal and Greece) and the average value between years 2017-2021, 26 regions out of 60 exhibited a negative net migration rate, with an average negative value of -4.3‰.
Indeed, depopulation is both an outcome and a process; a path-dependent process (Newsham, Rowe 2022; Franklin 2020) with a high degree of inertia, typical of all demographic processes (Sauvy 1957). While the decline in fertility rates may have initially triggered the process, it has now become self-sustaining, particularly at the local level and within small communities (Reynaud et al. 2020; Elshof 2014). The formation of such a self-reinforcing population decline is referred to a “systemic depopulation” process (Elshof 2014; Benassi et al. 2023)4.
The systemic characteristics of the depopulation process have led some of the most recent studies on this matter to adopt a holistic, diachronic and local scale approach (e.g. considering only Southern Europe: Benassi et al. 2023a, 2023b; Newsham, Rowe 2022; Caselli et al. 2020; Reynaud et al. 2020; Zambon et al. 2019). Some studies (Benassi et al. 2023a, 2023b; Reynaud et al. 2020) focused on the different geographies of population decline, exploring the spatial heterogeneity of the phenomenon and its demographic and socio-economic determinants. In contrast, other studies investigate the temporal path-profile of the process (Newsham, Rowe 2022), while others undertake a comprehensive analysis of the socio-economic determinants of shrinking populations at municipal level, identifying potential clusters of different combinations inside the systemic process (Caselli et al. 2020).
Newsham and Rowe (2022) applied a sequence analysis to the population growth of European local geographic units (NUTS level-3 = 696 units), between 2000 and 2008. After transforming numeric annual growth rates into categorical classes, the authors were able to classify seven different paths of population change5. Of these, the most noteworthy are Persistent Decline, Accelerating Decline, Persistent Moderate Decline and Accelerating Moderate Decline, as these can identify a population that is trapped inside a systemic depopulation process. Among the geographic units analysed, 57.8% are classified in these categories, primarily located in Southern and Eastern Europe (particularly in Italy, Portugal, the Balkans and the entire Eastern Europe), encompassing approximately 72 million people in 2000, with a decline of around 15.2 million people by 2008 (representing a decrease of 21%). The proposed methodology takes an innovative approach to understanding the systemic depopulation process and its path dependence. However, when assessed in terms of policy efficacy, it reveals a lack of sensitivity to initial changes in direction and a significant reliance on the transformation from numeric growth rates to categorical classifications and relative thresholds.
Caselli et al. (2020) investigated the factors influencing population decline in small and mid-sized Italian municipalities experiencing depopulation. Their analysis encompassed 3,500 municipalities, including those that experienced population decline during the period from 1991 to 2011 (preceding the national decline) and the subsequent 5 years (2012-2016), totaling 25 years of data. Using a multilevel and multiscale analysis, they were able to identify seven clusters of different combinations of five factors related to systemic depopulation: ageing, wealth/poverty, business performance, unemployment, and peripherisation6. The different clusters identify different combinations of factors and then different aspects to prioritise to reverse the systemic depopulation process. This analytical framework, known as the “Performance-based Cluster Model,” has the potential to inform policy interventions in shrinking regions. However, its efficacy in detecting reverse processes remains to be evaluated.
Finally, adopting a spatial perspective, Reynaud et al. (2020) emphasized the importance of territorial characteristics (such as altitude or accessibility to public services) and self-reinforced cycles of depopulation. As Franklin (2019) highlighted, population decline can co-occur with population growth: depopulation can take place within a larger context of growth and vice-versa (Sonnino et al. 1990). Benassi et al. (2023a; 2023b) demonstrated that the determinants of local population changes are not spatially constant but are variable in their effects at different geographical scales and spatial structures. This invites further research on depopulation to go beyond classic Ordinary Least Square (OLS) models and to consider spatial dimensions both using global regression models, such as the spatial lag model, the spatial error model, and the spatial Durbin model, and local regression models, such as GWR and MGWR7. The insights gained from these studies on spatial heterogeneity serve to reinforce the selection of a local-scale index of systemic depopulation. As Neumark & Simpson (2015) suggested, reversing systemic depopulation calls for “place-based policies”, which in turn necessitate appropriate monitoring tools (Muti 2023).
All the cited studies have produced different varying depictions of depopulation at the local level, by calculating the average annual growth rate of the municipal populations over a given period. This demographic index is synthetic and easy to calculate and replicate, both of which are highly valued in policy planning and monitoring contexts. The use of a threshold based on the distribution of growth rate values is a common practice to distinguish between mild and severe population decline on the one hand, and mild and severe growth on the other, as it enables policymakers to target investment programs to areas where they are most needed. For example, the studies by Reynaud et al. (2018, 2020) and Benassi et al. (2023a; 2023b) on Italian municipalities experiencing depopulation both identified -8‰ as the threshold at which severe population shrinkage can be detected. However, it is important to note that the annual average growth rate calculated over a given period does not always accurately reflect the changes in trend that have occurred over that period. In addition, the average annual growth rate may be influenced by important but exceptional events, such as the global pandemic of coronavirus (Covid-19) in 2020-2021 or changes in migration legislation.
In summary, recent studies have reached a consensus that depopulation is a demographically and geographically diverse phenomenon, necessitating its examination through the following lenses: i) as a path-dependent process; ii) employing a local level of geographic detail; and iii) utilising a diachronic approach. This article proposes a novel index, designed to capture the initial indications of a reverse in the systemic depopulation process, functioning as a monitoring tool for place-based policies.
3. The Molise case study
Southern Italy is one of the European regions most affected by systemic depopulation (Newsham Rowe 2022; Reynaud, Miccoli 2018, Reynaud et al. 2020), and Molise is one of the regions in the south of Italy that has experienced the strongest population decline (Fig. 1). The Italian National Institute of Statistics estimated the population of Molise to be approximately 320,000 in 2002 (ISTAT). This figure has decreased to 294,294 in 2021, indicating an annual growth rate of -4.4‰, which is notably lower than the growth rate of approximately 1.8‰ observed in Italy during the same period8.
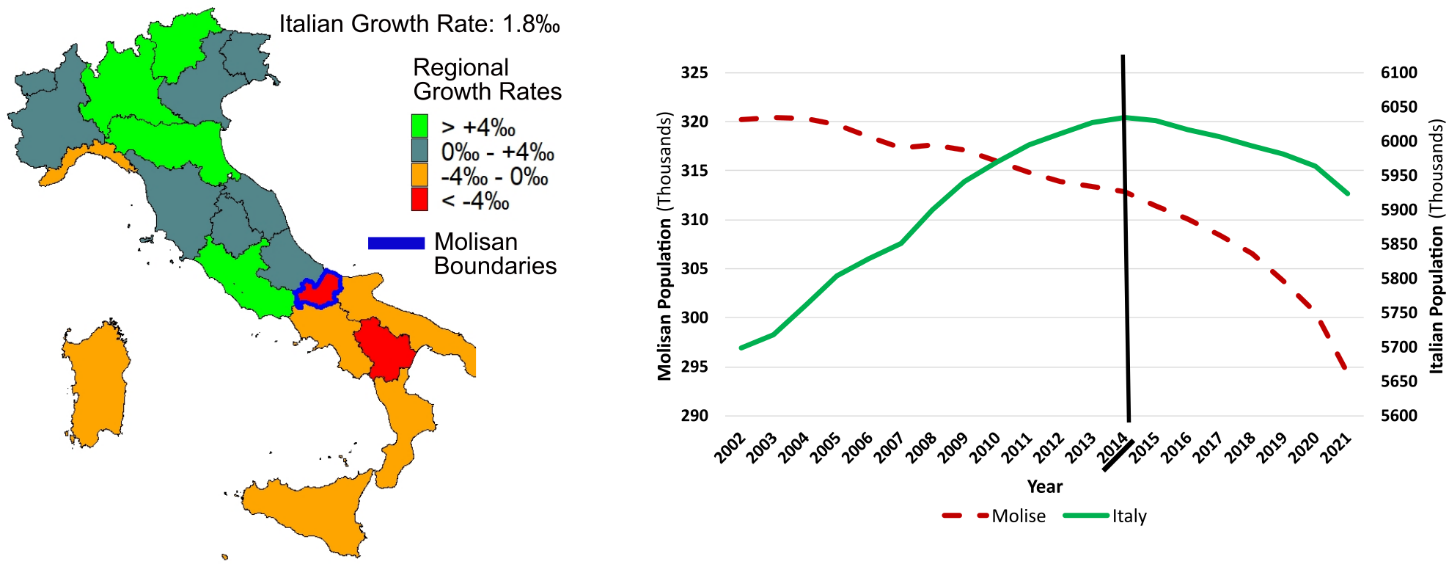
Furthermore, even during the period 2014-2021, i.e. the years of the continuous national population decline (see Figure 1, right panel), the Italian population decreased by approximately 1 million, i.e. around -3‰ annually, while the Molisan population decreased by approximately 19,000, i.e. around -9‰ annually. Finally, the average Total Fertility Rate (TFR) in Molise in the years 2017-2021 was 1.12, and the Net Migration Rate (NMR) was -4‰, while in Italy, the corresponding figures were 1.28 and 0.7‰, respectively.
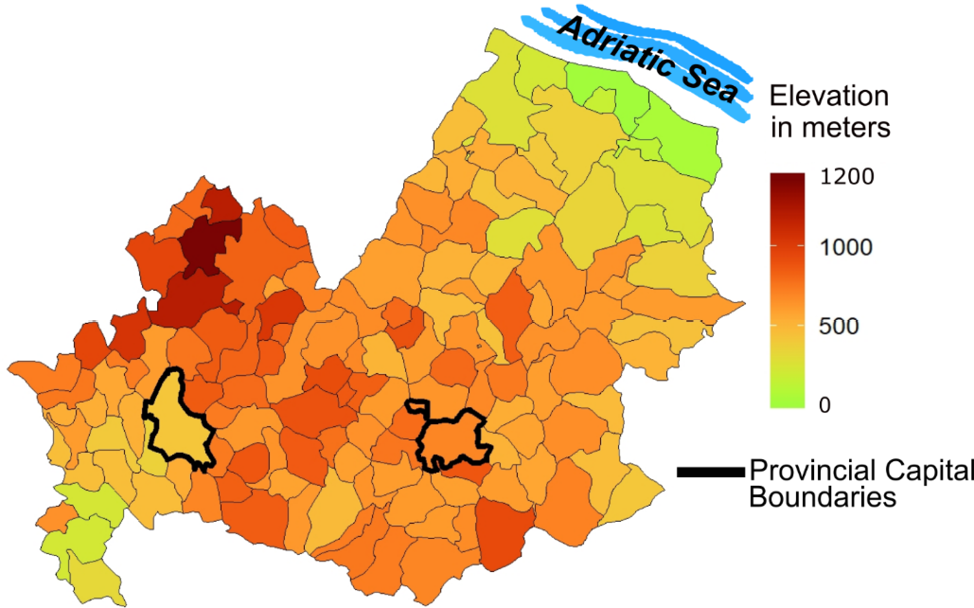
The Molise region is characterised by considerable mountainous terrain and a coastal zone in the north-east (Fig. 2). According to ISTAT (2022), 76.5% of Molise municipalities (which account for 68.6% of the population) are in “Inner Areas”9. These are defined as marginalised areas that are distant from public services (Fig. 3).
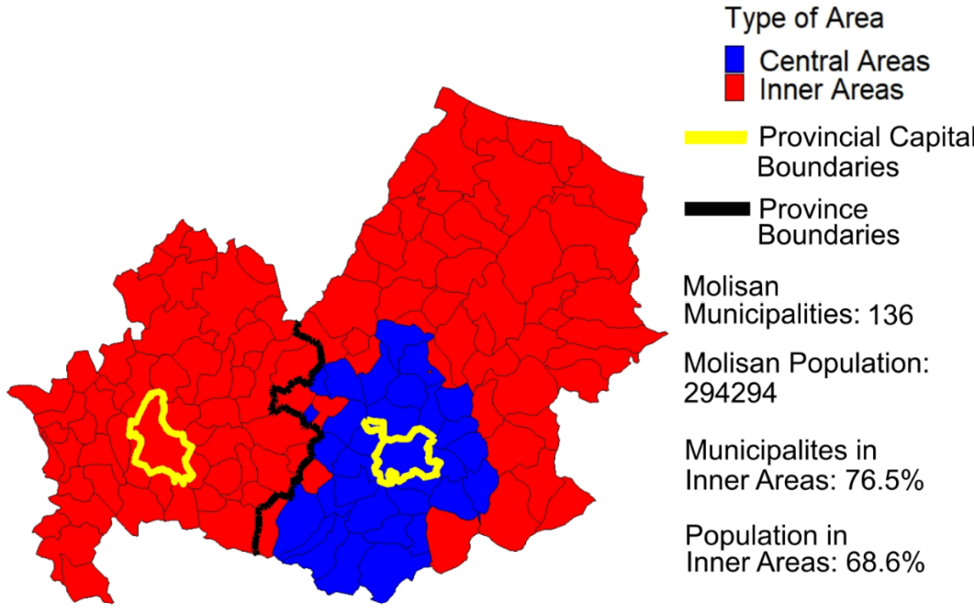
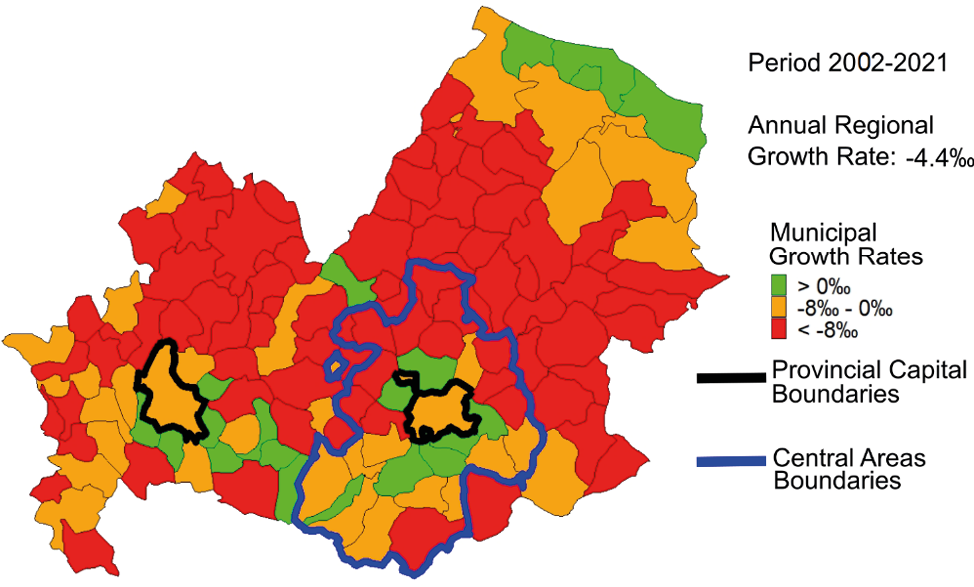
As suggested by Reynaud et al. (2020), geographical remoteness and challenges in accessing public services are significant catalysts for systemic depopulation processes (for a historical framework in the Molise context, see also: Sarno 2019, Muscarà 2008, Ruggieri 1982, 1976, Pecora 1955). Notable heterogeneity emerges when examining the growth rates calculated by municipal area in Molise for the years 2002-2021 (Fig. 4). Considering these observations, it is unsurprising that Molise has become a primary target of the National Strategy for Inner Areas (SNAI), a pivotal Italian policy designed to counteract depopulation processes at the local level. The National Strategy prioritises the promotion and preservation of Inner Areas assets and local communities, with a focus on enhancing their natural and cultural resources, establishing new employment circuits, and generating new opportunities. The strategy aims to counteract the substantial demographic decline through a socio-economic structural transformation (Barca, Carrosio 2020; Barca 2015; Barca et al. 2014). In 2023, 72 municipalities in Molise were targeted by this policy, representing approximately 53% of all municipalities in the region. This outcome was achieved through a collaborative, bottom-up decision-making process10. There are four distinct areas of intervention, each with its own specific objectives, which have been determined by the geographic and socio-demographic situation. These areas are Alto Medio Sannio (AMS, High-Middle Samnium), Fortore (F), Mainarde (Mai), and Matese (Mat)11. The interventions commenced in 2015, but the projects have only recently become operational. In addition to the SNAI programme, the ‘Resilience and Recovery Plan’ must also be mentioned. This extraordinary financial plan, which was approved by the European Council in 2020, aims to improve infrastructure and counteract the depopulation of marginalised areas (Italian Council of Ministers, 2021). In conclusion, the demographic history and current characteristics of Molise, its spatial heterogeneity and geomorphological characteristics, the continuous and significant attention received by geographers and demographers, and the investment policies that soon could potentially have an impact on a considerable fraction of its territory (SNAI and RRP projects), make Molise a good case of study for a first attempt to design and apply a simple systemic depopulation index at local level.
4. The SyDAs Index
4.1 Rationale
Systemic depopulation is a process which is dependent on both space and time. It is characterized by spatial heterogeneity at a very local level, involving all demographic engines (mortality, fertility, migrations), economic and institutional aspects, and the age structure of the population (e.g. the proportion of older people), which in turn has a direct impact on birth rates and mortality. The population structure has a “memory effect”, thereby conferring a high degree of inertia to depopulation. However, at the very local level and within small communities, there is the potential for erratic and exceptional temporary fluctuations without consequences for the mid-long run trend.
Modelling and estimating the trends of the municipal populations affected by severe shrinkage, while accounting for potential temporal autocorrelations, emerges as the optimal approach due to its robustness and the relative ease of accessing the necessary data. Modelling the trend, rather than relying only on average annual growth rates and relative thresholds, allows changes in the direction of population growth to be better captured, making the estimate more “sensitive”. Despite the absence of direct measurement of the determinants of systemic depopulation, analyzing population change over time can foster a “symptomatic” approach to understanding the phenomenon. Finally, considering municipalities as the smallest available statistical unit, the territory’s heterogeneity can be mapped with a satisfactory level of detail.
The objectives of the present study closely align with those of time-series analysis, a methodology previously employed in demographic research (e.g., Vanella et al., 2023, 2020; Shang, Hyndman, 2017). In this study, time-series analysis is applied to develop a binary index specifically designed to assist policymakers in assessing the effectiveness of policies intended to counteract systemic depopulation. The two fundamental objectives of time series analyses can be outlined as follows: firstly, the identification of the nature of the phenomenon that is represented by the sequence of temporally ordered observations; secondly, the forecasting of future values of the time series variables. The nature of time series can be affected by seasonality (i.e. fluctuations with fixed time frequency), cyclicity (i.e. fluctuations that have no fixed frequency), autocorrelation (i.e. when the values at time t+n depends on the value at time t), and finally, trend (i.e. a long-term increase or decrease). In summary, time series methods such as ARMA (Autoregressive and Moving Average) or ARIMA (Autoregressive Integrated and Moving Average) models facilitate the modelling of temporal trends whilst simultaneously considering the structural dynamics of the series (i.e. autocorrelations, cyclicity, seasonality and trend, see: Hyndman, Athanasopoulos 2018; Pankratz 1991). Time series methods can be used to create indexes that can detect long-term negative population change trends, independent of the effects of erratic/cyclical fluctuations and structural inertia. In this study we used such trend as basis for the design of a bynary indicator named Systemic Depopulation Areas Index (SyDAs).
Indeed, negative growth solely attributable to inertia or erratic events reflects past demographic history or exceptional occurrencesbut it does not necessarily constitute a systemic depopulation process. Policymakers should differentiate not only the severity of population decline (using local average growth rates and categorical thresholds) but also the underlying causes – whether systemic, exceptional, or inertia-driven – particularly in contexts marked by resource scarcity. These distinctions are essential, as each form of depopulation necessitates tailored policy responses and monitoring, as previously described. SyDAs have been designed to assist in this regard.
4.2 Data
Population data as of January 1st for all 136 municipalities in Molise were collected for the 19-year period spanning 2002 to 2021, using an open-access database provided by the Italian National Institute of Statistics (ISTAT)12. The database originates from two censuses (in 2001 and 2011), inter-census reconstructions (years 2001-2011, and 2012-2017), and the new Permanent Census (2018 onwards). It is noteworthy that the boundaries and number of municipalities remained constant throughout the observed period assuring robust comparison from a geographical perspective. Further descriptions of the data can be found in Annex A.
4.3 Methods
To provide policymakers with a straightforward index capable of distinguishing between local populations affected by severe shrinkage and those that are also experiencing systemic depopulation, a binary indicator, the Systemic Depopulation Areas Index (SyDAs), has been used. This index is based on a linear regression model that incorporates an ARIMA process in the error structure and has been applied to municipalities that had experienced severe population decline. The threshold to indicate severe shrinkage (average annual population decline <-8‰) was determined according to recent literature (Reynaud, Miccoli 2018; Reynaud et al. 2020; Benassi et al. 2023a; 2023b). The following paragraphs will describe the formalisation of the model. These will be preceded by an exhibition of alternative methods that will be used for comparison in the results section.
The data set under consideration comprises information on the population “
” of a given municipality, “
”,
which has been collected on the 1st of January on an annual basis from 2002 (“
”) to 2021 (“
”), encompassing a total period of 19 years (“
”). Municipalities have been further divided between those experiencing severe shrinkage (“
”, average annual growth <-8‰) and those not experiencing such shrinkage “
”.
A simple OLS regression enables the estimation of linear relationships between population and time for each municipality (“ ”) that exhibited an average annual growth rate of less than -8‰ during the period from 2002 to 2021.
[1]
In this case it is possible to robustly consider the existence of a systemic depopulation process in each municipality “ ”, if the parameter is significantly negative (i.e. if the p-value is lower than 0.001) and the R2- adjusted index of the model is bigger than 0.95, in order to evaluate the goodness of fit of the linear assumption: the absence of any significant interruptions to a continuous decline would be indicative of systemic depopulation.
[2]
Nonetheless, a simple linear regression is incapable of managing an autoregressive structure of data. To manage such data, it is necessary for the error component “ ” of the linear regression to contain an ARMA “ ” (equation 3) or ARIMA “ ” (equation 4 and 5) process. The former allows for the modelling of a deterministic trend, while the latter facilitates the modelling of a stochastic trend, both of which incorporate an autoregressive component within the error structure. The stochastic trend constitutes the foundation of the Systemic Depopulation Areas Index (SyDAs).
[3]13
With:
[4]
With:
Equation 4 can be “differenced” (see: Hyndman & Athanasopoulos, 2018) on both sides:
[5]
With:
Deterministic ARMA and stochastic ARIMA trend regression models comprise two error terms: the total regression model error ( and ), and the ARMA or ARIMA process error ( ). The former is further modelled with and parameters, which capture the autoregressive structure of error (demographic inertia) and control the impact of other non-trend components (random changes, exceptional events or short cycles) on the estimation of and the goodness of fit of the regression. Moreover, the linear model obtained through a stochastic trend exhibits a non-stationary structure of error. This property is particularly salient in scenarios where the slope of the trend undergoes a change over time, while retaining a negative gradient in average. This property of the stochastic trend enhances the flexibility of the model estimation of parameter , and consequently a better estimation of the binary SyDAs index, that aims to capture the symptom of an active systemic depopulation process, rather than the magnitude of the depopulation rate.
As described in Hyndman and Khandakar (2008), trends modelled by deterministic ARMA and stochastic ARIMA error regression are estimated for each of the 136 municipalities using a recursive algorithm. Implementation of this algorithm occurs within the “forecast” package of the R statistical environment. The algorithm employs Kwiatkowski-Philips-Schmidt-Shin test (KPSS) to determine the order of differencing (“ ”) and thereafter optimizes the value of AICc and MLE considering different combination of autoregressive and moving average components, including the order of autoregressive (“ ”) and moving average (“ ”) processes. Finally, portmanteau tests (Ljung Box Test) at the conclusion of each final optimisation performed by the algorithm confirm that the residuals (“ ”) are white noise. In the next section the SyDAs index is applied to each Molisan municipality for the period 2002-2021.
5. Results
Figure 5 and the subsequent figures provide an overview of depopulation in Molise, complementing the information already presented in Figure 4. The maps were created with the aim of guiding policymakers on where to intervene most urgently to address the disappearance of municipalities. Figure 5 and the subsequent figures highlight in dark red the municipalities requiring intervention according to the different approaches previously described, specifically those exhibiting severe decline and symptoms of an ongoing systemic depopulation process. The left panel of Figure 5 maps Molise using the traditional average annual growth rate indicator for the period 2002–2021, with a threshold of -8‰. In contrast, highlighting in dark red only those municipalities where the annual growth rate was below -8‰ and consistently negative each year from 2002 to 2021. To allow for a comparison with the traditional method, municipalities with an average annual growth rate below -8‰ but without consistently negative growth rates each year are marked in light red.
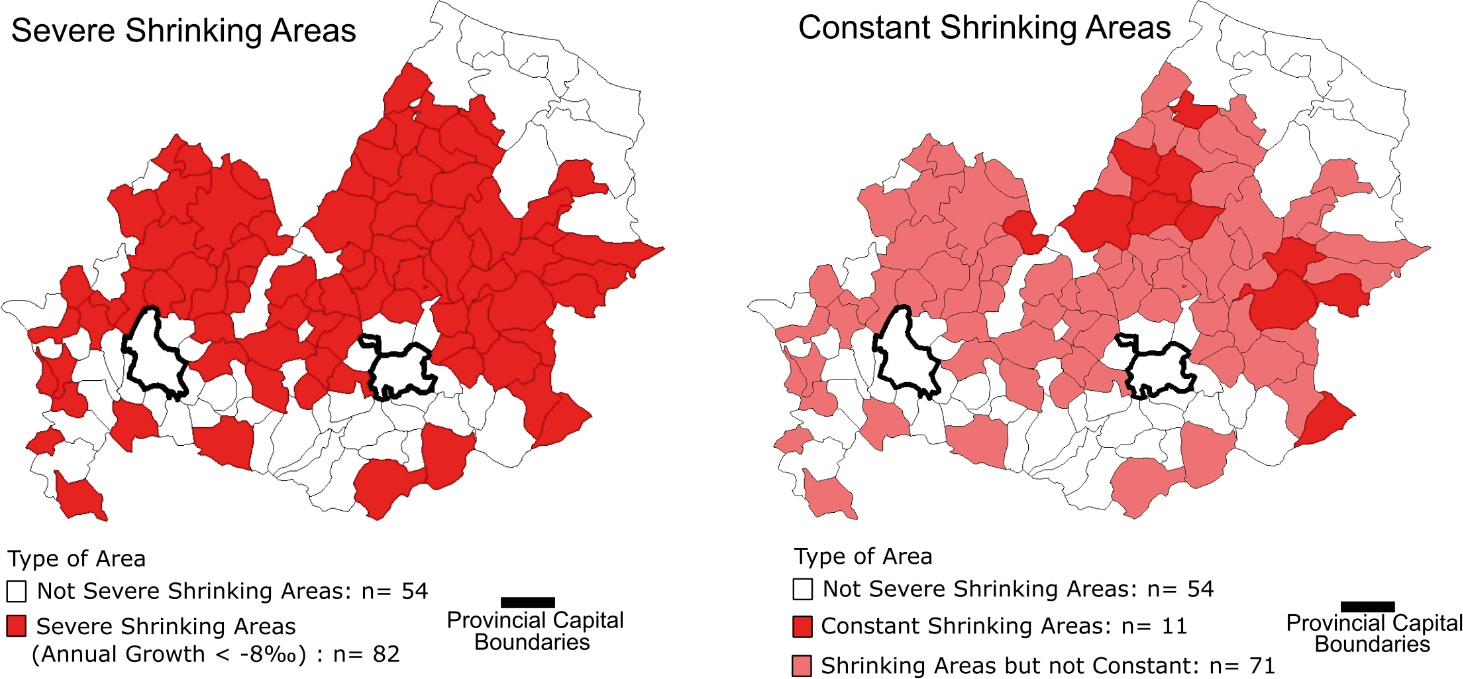
A total of 82 out of 136 municipalities (approximately 60%) experienced a population decline from 2002 to 2021, with an average annual growth rate below -8‰. Conversely, only 11 municipalities (8% of all municipalities and 13% of the areas demonstrating severe shrinkage) exhibited a continuous decline during the observed period, i.e. a decline in every year from 2002 to 2021. However, as previously highlighted, at the local scale and for small communities, erratic changes and volatility frequently occur but have no effects on the mid-long run. An analysis of long-term trends is therefore necessary.
Prior to the discussion of the results of the SyDAs Index application to Molise (model [4-5]), the outcomes will be illustrated in the case of alternative trend estimates: simple OLS regression and ARMA deterministic trend (models [1] and [3] respectively).
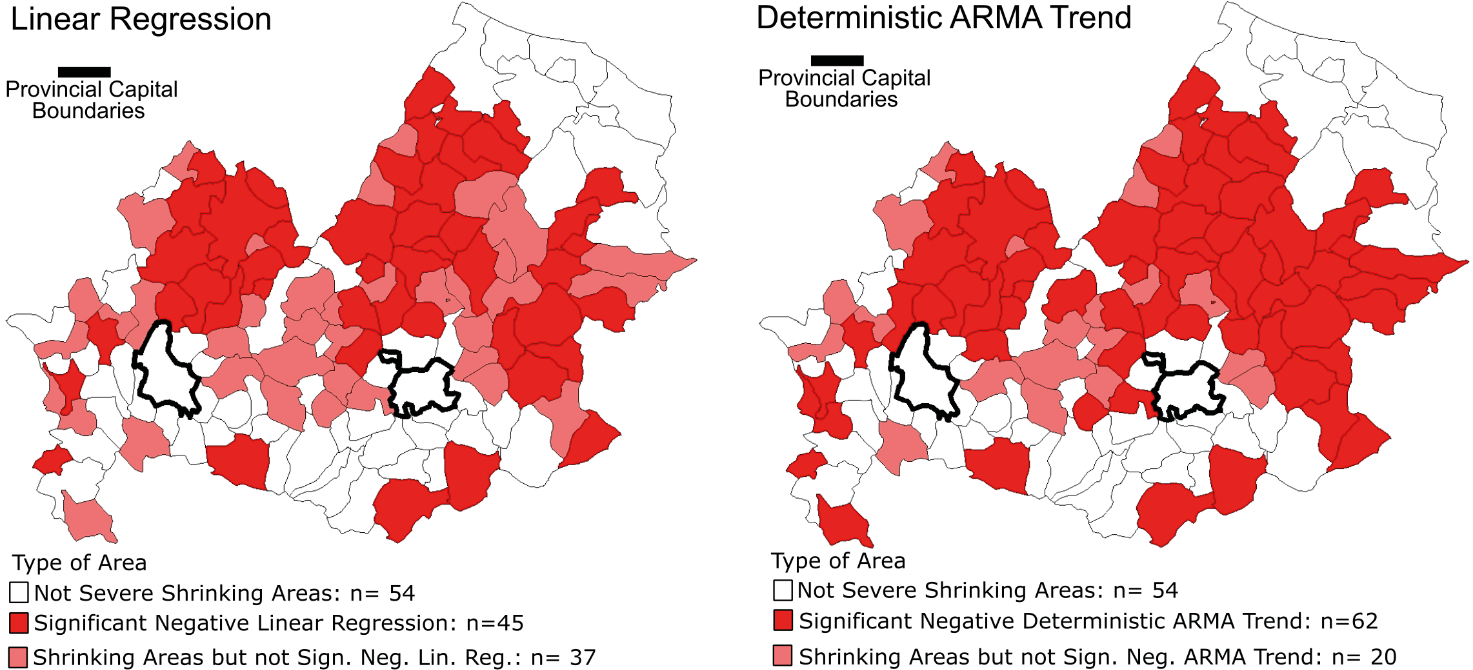
Using basic OLS regression, 45 municipalities (33% of all municipalities and 55% of shrinking areas) display a statistically significant negative linear trend (see Figure 6, left panel. To allow for a comparison with the traditional method, municipalities with an average annual growth rate below -8‰ are marked in light red). It should be noted that this model does not consider any potential autocorrelation components. To consider the impact of demographic inertia and short cycles due to exceptional events, it is necessary to include an autoregressive process in the error structure of the linear regression (ARMA deterministic trend). In this case, 62 municipalities (46% of all municipalities and 76% of shrinking areas) show a significant negative trend (see the Figure 6, right panel).
Finally, considering a non-stationary structure of errors, the analysis of a stochastic negative trend estimated by the ARIMA model is shown: i.e. the SyDAs Index, represented in Figure 7. In this case, the systemic depopulation process is identified in 55 municipalities (40% of all municipalities and 67% of shrinking areas). This is a lower number than expected using a deterministic ARMA trend (due to relaxing the assumption of a constant trend slope), but higher compared to a simple linear regression (while controlling for autoregressive and cyclical structures). With the exception of the North-East area, i.e. the coastal zone of Molise, and the areas surrounding the two province capitals (the Campobasso belt on the right and the Isernia belt on the left, see also Figure 3), the majority of the mountainous territory of Molise is affected by a systemic depopulation process. However, there are notable exceptions to this trend. Municipalities in the northern Isernia belt and the lowlands (i.e. the North-East, adjacent to the coastal zone) show evidence of systemic depopulation, while municipalities in the mountainous areas between the two belts do not exhibit this trend. A differential analysis incorporating spatial autoregressive effects on the combinations of demographic and socio-economic characteristics in these groups could help explain such exceptions and offer valuable insights for policy planning.

An empirical comparative analysis of the diverse municipal trajectories in terms of population balances and change over the period 2002-2021 can be useful to observe in detail the differences between the three categories of municipalities detectable by SyDAs (Not Severe Shrinking, SyDAs and Shrinking Not SyDAs). Figure 8 shows two cases of municipalities identified by the SyDAs Index as affected by systemic depopulation, namely Ururi and Forlì del Sannio. Figure 9 illustrates municipalities experiencing severe population decline but not part of a systemic depopulation process, as Frosolone and Castellino del Biferno. Finally, Figure 10 provides an example of two municipalities not affected by severe shrinkage, namely Campomarino and Campobasso. A more comprehensive overview of the findings from the various regression analyses can be found in Annex B.
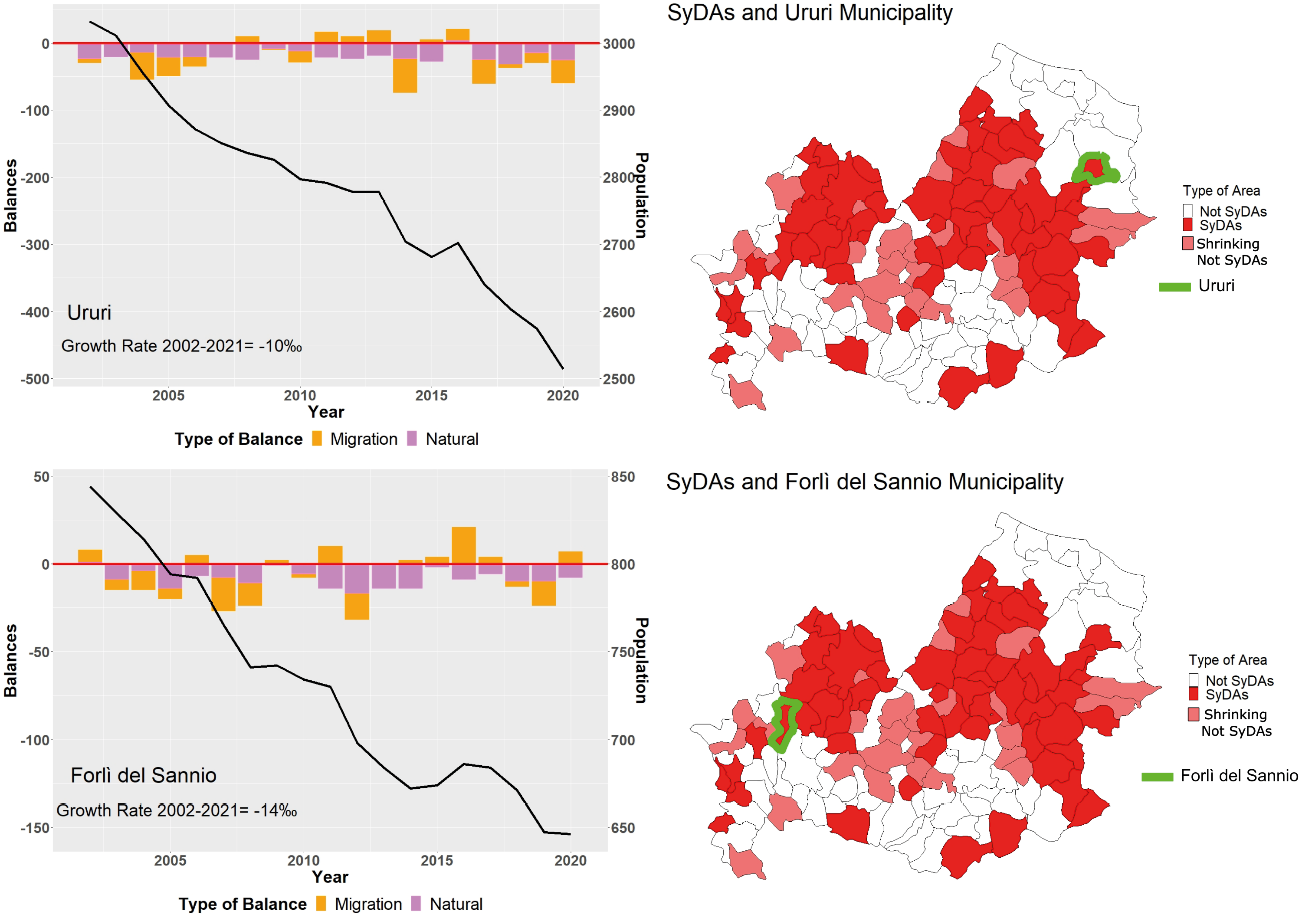
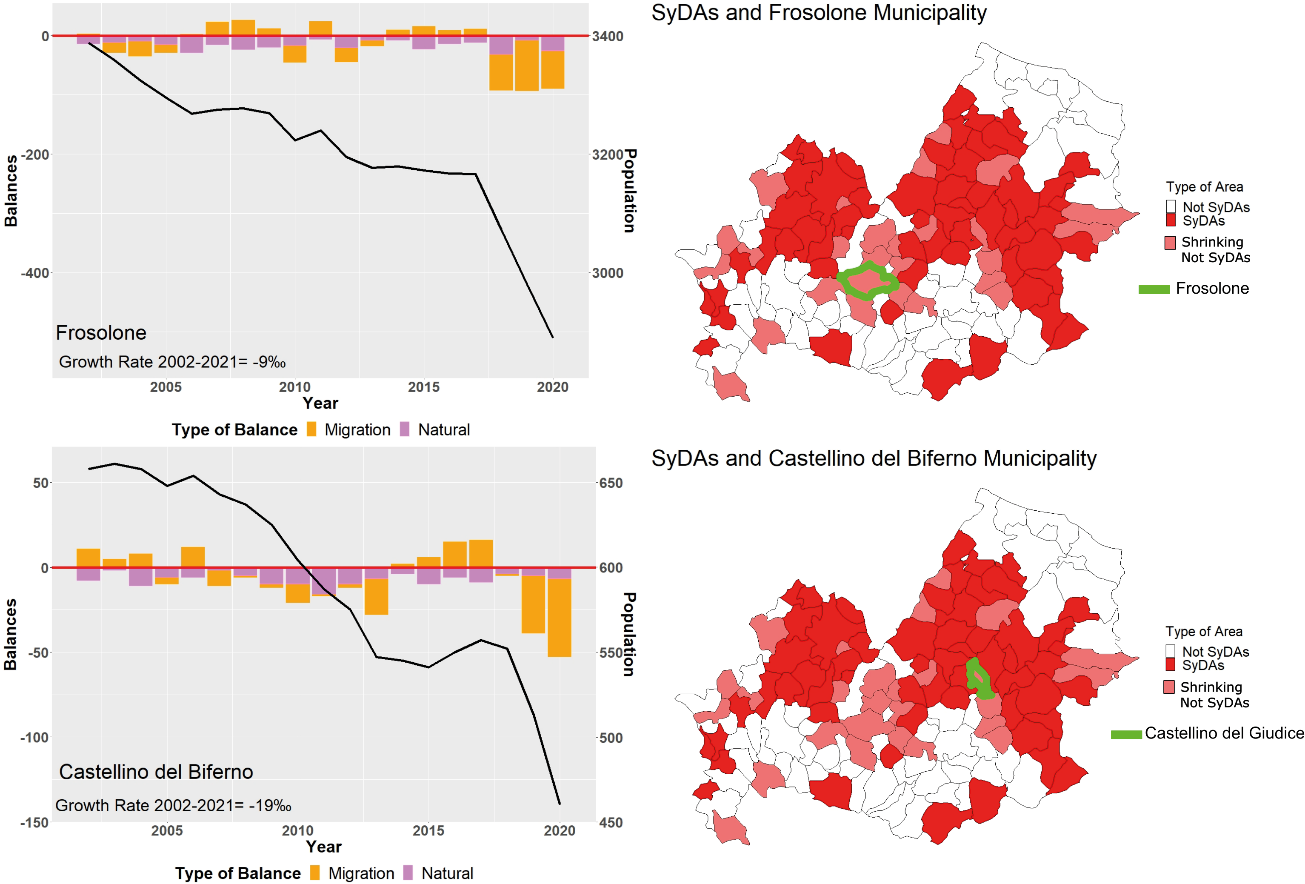

As illustrated in Figures 8, 9 and 10, all the municipalities under consideration have experienced a decline in population between 2002 and 2021. The only exception is Campomarino, which has shown an increase of approximately 10‰ (Fig. 10). Adopting a conventional classification based on a threshold (cf. Reynaud, Miccoli 2018; Reynaud et al.2020; Benassi et al. 2023a; 2023b), Ururi, Forlì del Sannio, Frosolone and Castellino del Biferno should be regarded as being in the same condition. The SyDAs index, on the contrary, can distinguish between municipalities characterised by a negative long-term trend (symptom of a systemic depopulation process), like Ururi and Forlì del Sannio, and municipalities that are not, like Frosolone and Castellino del Biferno. Indeed, these last two municipalities have experienced a significant decline in population in the last two years of observation, coinciding with the epidemic period of the novel Coronavirus (Covid-19). This decline is primarily attributed to an exceptional negative migration balance, a phenomenon that is not necessarily indicative of underlying structural changes (Billari 2022). Furthermore, while the ARMA model identifies Castellino del Biferno as affected by systemic depopulation (Figure 6, right panel), the SyDAs index is better able to evaluate the erratic nature of the population decline due to the pandemic. Conversely, where the OLS linear regression would exclude the municipality of Forlì del Sannio from systemic depopulation (Fig. 6, left panel), the SyDAs index is able to identify systemic decline, relaxing the assumption of no changes in the negative slope and including autoregressions in the error structure.
Finally, as a practical application example, we overlapped the SyDAs and the municipalities participating in the SNAI policy program (Fig. 11). Since the SNAI program was designed to curb and reverse depopulation in the most marginalized municipalities (Inner Areas) through public investments in infrastructure and services, it is useful to verify whether the intervention areas defined by SNAI overlap with the municipalities identified by SyDAs as being most at risk of depopulation.

The SNAI programme covers 72 Molise municipalities, but the SyDAs index identifies only 55 of these as being affected by systemic depopulation. However, the four intervention zones of the SNAI programme exclude 20 of the 55 municipalities identified by the SyDAs index (36%). These municipalities are primarily located in the lowlands of the north-eastern region, in proximity to the coastal zone. Conversely, 37 municipalities incorporated within the SNAI program do not exhibit systemic depopulation characteristics (47% of the 81 municipalities not experiencing systemic depopulation). These municipalities are predominantly situated in the mountains between the two provincial towns.
6. Discussion
The application of the SyDAs index to the municipalities of Molise has demonstrated a potential method for distinguishing, among municipalities with negative average annual growth rates, those requiring more urgent intervention due to being symptomatic of systemic depopulation. The binary index, calculated over the same period as the average annual growth rate, provides a standardized method that allows for a concise and immediate understanding of the differences between municipalities without the need to analyse their annual evolution individually. Furthermore, by adjusting the analysis periods of the SyDAs, it may be possible to assess any changes following the implementation of investment policies. This latter application would not be possible using only average annual growth rates (cf. Reynaud et al. 2020; Newsham, Rowe 2022), which would fail to capture changes in the structure of the trend. Meanwhile, a single, municipality-by-municipality analysis of population trends over time would require a lengthy analysis and would not yield easily synthesizable results. Consequently, SyDAs emerge as a promising candidate among policy evaluation indices, particularly when the objective is to discern any substantial signal of a reversal in systemic depopulation processes at the local level. Moreover, mapping the territory’s heterogeneity applying the SyDAs Index, that does not consider spatial regressive effects, could serve the scope of further spatial regressive models, including the study of socio-economic determinants and correlations.
The SyDAs indicator has also shown potential mismatches between the intervention areas already defined by public investment programs and the municipalities most exposed to systemic depopulation. For example, the areas defined as most marginalised by the SNAI investment program and simultaneously located in hard-to-access mountainous regions do not appear to be affected by systemic depopulation processes as expected. On the other hand, areas not identified as marginalised by the SNAI program and located in hilly or flat regions instead show symptoms of a systemic depopulation process.
This could suggest that the SyDAs index may have captured early signals of revitalization in some municipalities while revealing previously masked deflecting processes in others.
The index proposed in this study is only a first step toward providing policymakers with a tool to assess the effectiveness of policies aimed at curbing and reversing systemic depopulation processes. Further testing on larger and more diverse areas is required, alongside a sensitivity analysis to better determine depopulation thresholds, or potentially eliminate them altogether. The period of observation (19 years) is not long for time series as typically has been used in previous studies. Tests on longer series as training sets should be conducted. However, SyDAs uses no variables except time, and the Hyndman-Khandakar method minimizes the AICc value. This restricts the number (order) of parameters related to the autoregressive error structure, ensuring that the simplest model is selected for each regression and mitigating potential overfitting problems.
Finally, the symptomatic approach allows for calculating the index without complicating the model or burdening the research and data updates. However, the inclusion of some covariates (both demographic and economic) in the regression model could enhance the explanatory power without compromising its parsimony (Caselli et al. 2020).
7. Conclusions
The SyDAs index has been developed to be sensitive in detecting the inversion of a systemic depopulation process, while simultaneously being able to ignore some volatility in population changes that can occur when analysing very small populations. It has been designed to be very simple in assumptions and computations, and parsimonious in data requirements, to be applied at a local level. In the future, this index could serve as a valuable instrument for evaluating the efficacy of policies (SNAI and RRP) in addressing depopulation at the local level. Furthermore, the results indicated a potential discrepancy between the geographic areas of policy intervention and the local areas that are particularly in need of intervention to halt the population decline. Given the bottom-up and co-decision structure of the SNAI programme, this finding necessitates a closer look at the capabilities of local administrators, which may be linked to the population decline itself and thus contribute to ongoing systemic depopulation.
Acknowledgements
This publication was produced with the co-funding European Union – Next Generation EU, in the context of the PNRR, Missione 4, Componente 2, PE8 "Conseguenze e sfide dell’invecchiamento", Project Age-It (Ageing Well in an Ageing Society) and in the context of the PRIN 2022-PNRR research project “Foreign population and territory: integration processes, demographic imbalances, challenges and opportunities for the social and economic sustainability of the different local contexts (For.Pop.Ter)” [P2022WNLM7], funded by European Union—Next Generation EU, component M4C2, Investment 1.1.
References
Alamá-Sabater, L., Budí, V., Roig-Tierno, N., García-Álvarez-Coque, J.M. (2021). Drivers of depopulation and spatial interdependence in a regional context. Cities, 114. https://doi.org/10.1016/j.cities.2021.103217.
Antulov-Fantulin N., Lagravinese, R., Resce, G. (2021). Predicting bankruptcy of local government: A machine learning approach. Journal of Economic Behavior & Organization, 183, 681-699. https://doi.org/10.1016/j.jebo.2021.01.014
Barca, F., Carrosio, G. (2020). Un modello di policy place-based: la Strategia Nazionale per le Aree Interne. In Osti, G., Jachia, E. (Eds.). Un disegno di rinascita delle aree interne. Bologna, Il Mulino.
Barca, F. (2015). Un progetto per le aree interne dell’Italia. In Meloni, B. (Ed.). Aree interne e progetti d’area. Turin, Rosenberg & Sellier. http://digital.casalini.it/4918550
Barca F., Casavola P., Lucatelli S. (2014). A Strategy for Inner Areas in Italy: Definition, Objectives, Tools and Governance. Materiali UVAL, n.31. https://www.agenziacoesione.gov.it/wpcontent/uploads/2020/07/MUVAL_31_Aree_interne_ENG.pdf
Benassi, F., Busetta, A., Gallo, G., Stranges, M. (2023a). Neighbourhood effects and determinants of population changes in Italy: A spatial perspective. Vienna Yearbook of Population Research, 21, 1-28. https://doi.org/10.1553/p-5dfz-c44a
Benassi, F., Mucciardi, M., Gallo, G. (2023b). Local population changes as a spatial varying multiscale process: The Italian case. International Journal of Population Studies, 9(1). https://doi.org/10.36922/ijps.393
Caselli, B., Ventua, P., Zazzi, M. (2020). Performance-based spatial monitoring. An interpretative model for long-term shrinking medium-small Italian towns. Sustainable Cities and Society, 53. https://doi.org/10.1016/j.scs.2019.101924
Coleman, D., Rowthorn, R. (2011). Who’s Afraid of Population Decline? A Critical Examination of Its Consequences. Population and Development Review, 37, 217-248. http://www.jstor.org/stable/41762406
Christiaans, T. (2017). On the implications of declining population growth for regional migration. Journal of Economics. 122(2), 155-171. https://doi.org/10.1007/s00712-017-0556-2
Demeny, P. (1997). Replacement-level fertility: the implausible endpoint of the demographic transition. In Jones, G.W. et al. (Eds.). The continuing demographic transition. Oxford, Clarendon Press, 94-110.
European Economic and Social Committee - EESC (2020). Demographic challenges in the EU in light of economic and development inequalities (Exploratory opinion at the request of the Croatian presidency). https://www.eesc.europa.eu/en/our-work/opinions-information-reports/opinions/demographic-challenges-eu-light-economic-and-development-inequalities-exploratory-opinion-request-croatian-presidency
Elshof, H., van Wissen, L., Mulder, C.H. (2014). The self-reinforcing effects of population decline: An analysis of differences in moving behavior between rural neighborhoods with declining and stable populations. Journal of Rural Studies, 36, 285-299. https://doi.org/10.1016/j.jrurstud.2014.09.006
EU Parliament (2021). Reversing demographic trends in EU regions using cohesion policy instruments. European Parliament resolution of 20 May 2021 on reversing demographic trends in EU regions using cohesion policy instruments (2020/2039(INI)). https://www.europarl.europa.eu/doceo/document/TA-9-2021-0248_EN.html
Franklin, R.S. (2020). I come to bury (population) growth, not to praise it. Spatial Economic Analysis, 15(4), 359-373. https://doi.org/10.1080/17421772.2020.1802056
Franklin, R.S. (2019). The demographic burden of population loss in US cities, 2000-2010. Journal of Geographical Systems, 23, 209-230. https://doi.org/10.1007/s10109-019-00303-4
Glass, D.V. (1940). Population Policies and Movements in Europe. London, Oxford University Press.
Goldstein, J.R., Lutz, W., Scherbov, S. (2004). Long-Term Population Decline in Europe: The Relative Importance of Tempo Effects and Generational Length. Population and Development Review, 29(4), 699-707.
Golini, A. (1997). Demographic trends and ageing in Europe. Prospects, problems and policies. Genus, 53(3/4), 33-74.
Hyndman, R.J., Athanasopoulos, G. (2021). Forecasting: principles and practice. Melbourne (Australia). OTexts. OTexts.com/fpp3
Hyndman, R.J., Khandakar, Y. (2008). Automatic time series forecasting: the forecast package for R. Journal of Statistical Software, 26(3), 1-22.
ISTAT. (2022). La Geografia delle Aree Interne nel 2020: vasti territori tra potenzialità e debolezze. https://www.istat.it/it/archivio/273176
ISTAT. (2024). La Demografia delle Aree Interne: dinamiche recenti e prospettive future. https://www.istat.it/wp-content/uploads/2024/07/STATISTICA-FOCUS-DEMOGRAFIA-DELLE-AREE-INTERNE_26_07.pdf
Italian Council of Ministers. (2021). Recovery and Resilience Plan. https://www.mef.gov.it/en/focus/documents/PNRR-NEXT-GENERATION-ITALIA_ENG_09022021.pdf.
Italian Presidency of the Council of Ministers. (2023). President Meloni’s addresses at the third edition of the States General on Natality. https://www.governo.it/en/articolo/president-meloni-s-address-third-edition-states-general-natality/22625
Kohler, H-P., Billari, F.C., Ortega J.A. (2002). The emergence of lowest-low fertility in Europe during the 1990’s. Population and Development Review, 28(4), 641-680. https://doi.org/10.1111/j.1728-4457.2002.00641.x
Lallo, C., Tomassini, C. (2023). Le Demografie Europee tra Migrazioni e Crescita Naturale. In Pace. L.F. (Ed.). Quo vadis Europa?. Roma, Edizioni Efesto.
Lutz, W. Gailey N. (2020). Depopulation as a Policy Challenge in the Context of Global Demographic Trends. S.l., United Nations Development Programme.
Martins, J.R. Davino, C. (2023). Local Migration Governance in European Shrinking Areas: A German and an Italian Case. Journal of International Migration and Integration, 24, 863-888. https://doi.org/10.1007/s12134-023-01029-5
Muscarà, L. (2008). Geo-demografia storica del Molise. In Marchetti, M. (Ed.). Relazione sullo Stato dell’ambiente della Regione Molise. Campobasso, Università del Molise, 37-61.
Muti, Ö. (Ed., 2023). Regional population diversity and social cohesion in the local context. Population Europe, 20. https://population-europe.eu/files/documents/dp_reg_pop_div_web_18.07.pdf
Neumark, D., Simpson, H. (2015). Place-based policies. Handbook of regional and urban economics, 5, 1197-1287. https://doi.org/10.1016/B978-0-444-59531-7.00018-1
Newsham, N., and Rowe, F. (2022). Understanding trajectories of population decline across rural and urban Europe: A sequence analysis. Population Space and Place, 29(3). https://doi.org/10.1002/psp.2630
Pankratz, A. E. (1991). Forecasting with dynamic regression models. New York, John Wiley & Sons.
Pecora, A. (1955). Sullo spopolamento montano degli Abruzzi. Bollettino della Società Geografica Italiana, 8(8), 508-514. https://www.bsgi.it/index.php/bsgi/article/view/5783
Resce, G. (2022). The impact of political and non-political officials on the financial management of local governments. Journal of Policy Modeling, 44(5), 943-962. https://doi.org/10.1016/j.jpolmod.2022.08.004
Reynaud, C., Miccoli, S., Benassi, F., Naccarato, A., Salvati, L. (2020). Unravelling a demographic ‘Mosaic’: Spatial patterns and contextual factors of depopulation in Italian Municipalities, 1981-2011. Ecological Indicators, 115. https://doi.org/10.1016/j.ecolind.2020.106356
Reynaud, C., Miccoli, S. (2018). Depopulation and the Aging Population: The Relationship in Italian Municipalities. Sustainability, 10(4). https://doi.org/10.3390/su10041004
Ruggieri, M. (1982). Evoluzione delle strutture insediative in Abruzzo. Bollettino Della Società Geografica Italiana, 10(11), 219-226. https://www.bsgi.it/index.php/bsgi/article/view/6335
Ruggieri, M. (1976). I terreni abbandonati: nuova componente del paesaggio. Bollettino Della Società Geografica Italiana, 10(5), 441-464. https://www.bsgi.it/index.php/bsgi/article/view/6202
Sarno, E. (2019). Il profilo geo-storico-demografico di Campobasso e la “secondarietà” del Molise. Bollettino Della Società Geografica Italiana, 9(3-4), 385-403. https://doi.org/10.13128/bsgi.v9i3-4.484
Sauvy, A. (1949). Le “faix problèm” de la population mondial. Population, 4(3).
Sauvy, A. (1957). Évolution récente en France et dans le monde. Population, 12(1).
Shang, H.L., Hyndman, R.J. (2017). Grouped functional time series forecasting: An application to age-specific mortality rates. Journal of Computational and Graphical Statistics, 26(2), 330-343. https://doi.org/10.1080/10618600.2016.1237877
Sobotka, T., Matysiak, A., Brzozowska, Z. (2019). Policy responses to low fertility: How effective are they? Working Paper, 1, UNFPA. https://www.unfpa.org/publications/policy-responses-low-fertility-how-effective-are-they
Sonnino, E., Birindelli, A.M., Ascolani, A. (1990). Popolamenti e spopolamenti dall’Unità ai giorni nostri, In Bevilacqua, P. (ed.). Storia dell’agricoltura italiana in età contemporanea. Uomini e classi. Venezia, Marsilio, 661-734.
Ubarevičienė, R., van Ham, M. (2017). Population decline in Lithuania: who lives in declining regions and who leaves? Regional Studies, Regional Science, 4(1), 57-79. https://doi.org/10.1080/21681376.2017.1313127
United Nations. (2022). World Population Prospects: The 2022 Revision. New York, United Nation, Population Division. https://population.un.org/dataportal/home
UNFPA. (2023). State of World Population report 2023: 8 billion lives, infinite possibilities the case for rights and choices. https://www.unfpa.org/swp2023
Vanella, P., Hellwagner, T., Deschermeier, P. (2023). Parsimonious stochastic forecasting of international and internal migration on the NUTS-3 level–an outlook of regional depopulation trends in Germany. Vienna Yearbook of Population Research, 21(1), 361-415.
Vanella, P., Deschermeier, P. A. (2020). Probabilistic Cohort-Component Model for Population Forecasting – The Case of Germany. Population Ageing, 13, 513-545. https://doi.org/10.1007/s12062-019-09258-2
Van de Kaa, D.J. (1987). Europe’s Second Demographic Transition. Population Bulletin, 42(1), 1-59.
Viesti, G. (2023). Riuscirà il Pnrr a rilanciare l’Italia?. Roma, Donzelli Editore.
Viesti, G. (2022). Una lettura territoriale delle dotazioni di personale dei Comuni italiani. Rivista economica del Mezzogiorno, 36(4), 939-974.
Zambon, I., Rontos, K., Serra, P., Colantoni, A., & Salvati, L. (2019). Population Dynamics in Southern Europe: A Local-Scale Analysis, 1961-2011. Sustainability, 11(1). https://doi.org/10.3390/su11010109
1 The terms “shrinking population”, “depopulation” and “population decline” are used interchangeably in this paper to refer to the descriptive phenomenon of a population that is decreasing in size. The definition of “systemic depopulation” is explained in the following sections of the paper.
2 Ageing is the classic phenomenon predicted by the fourth phase of the demographic transition theory. As the final equilibrium situation of the transition, it is not necessarily seen as a problem. On the contrary, intense population ageing can have potentially serious consequences. Some authors have called it “de-juvenation”, but this study proposes “over-ageing”: as in the metallurgical process of tempering, there is an optimal point of ageing: under-ageing and over-ageing make metals weaker.
3 Portugal, Spain, Italy, Greece and Malta. Data from Eurostat: https://ec.europa.eu/eurostat/databrowser/view/DEMO_PJAN/default/table?lang=en
4 It is preferable to designate such a process as “systemic” as opposed to “structural” or “systematic”, with a view to highlighting the intricate interplay of various social phenomena, including demographic, economic and institutional, that are intrinsic to society and inseparable. According to the Oxford Dictionary, systemic is defined as “affecting or connected with the whole of something, especially the human body or a society”.
5 The 7 paths are: Persistent Decline, Accelerating Decline, Diminishing Decline, Persistent Moderate Decline, Accelerating Moderate Decline, Diminished Decline, Temporary Decline.
6 The 5 indicators compare local measures to the national average, Ageing: Old Age Index; Wealth/Poverty: Per capita income; Business Performance: Labor productivity; Unemployment: Unemployment rate; Peripherisation: Marginal areas classification according to official statistics.
7 Geographically Weighted Regression (GWR), Multiscale Geographically Weighted Regression (MGWR).
8 We used continuous growth rate * 1000, where t=2002 and n=19.
9 ISTAT Inner Areas classification identifies municipalities with a joint offer of three types of service - health, education and mobility - called Service provision centres (one or more Municipality). All the other municipalities are classified on the basis of their distance from these Service provision centres (in terms of actual average road travel time), classifying them into four bands of increasing relative distance – Outlying areas, Intermediate, Peripheral, Ultra-peripheral – and, therefore, with a potentially greater inconvenience in the use of services. The municipalities classified as Intermediate, Peripheral and Ultra-peripheral represent all the Inner Areas of our country. More information on: https://www.istat.it/wp-content/uploads/2024/11/20220720_FOCUS_Inner_Areas_en.pdf.
11 Specific materials are available at: https://www.agenziacoesione.gov.it/strategia-nazionale-aree-interne/regione-molise-aree-interne/
12 More info on ISTAT database, Censuses and the new Permanent Census at: https://siqual.istat.it/SIQual/lang.do?language=UK
13 Deterministic ARMA and Stochastic ARIMA regression are modelled using the Hyndman-Khandakar algorithm that use KPSS test to determine the order of differencing “d”, AICc to determine the order of autoregressive (“k”) and moving average (“j”) component and MLE do estimate parameter β. AICc is the “corrected”Akaike Information Criteria for small sample sizes. AICc is a particularly useful tool when managing short time series, see: Hyndman, Athanasopoulos 2018, chapter 12.