https://doi.org/10.36253/bsgi-7554
Untapped Potential: Gender and Regional Disparities in Working Life Expectancy and its Trends in Italy
Potenziale inutilizzato: disparità di genere e regionali nella speraza di vita lavorativa e le sue tendenze in Italia
1 Max Planck Institute for Demographic Research, Rostock, Germany
2 Max Planck – University of Helsinki Center for Social Inequalities in Population Health, Rostock, Germany and Helsinki, Finland
3 Department of Economics, Business and Statistics, University of Palermo, Italy
E-mail: lorenti@demogr.mpg.de; annalisa.busetta@unipa.it
Abstract. As societies globally cope with the challenges of an aging population, pension systems face increasing strain. Italy, one of Europe’s largest economies and oldest populations, provides a compelling case for examining the complex interplay between gender and regional disparities in the context of extended working lives. The study of Working Life Expectancy across Italian regions from 2000 to 2016 reveals a generally upward trend and shows the complex dynamics of the aging workforce. While the overall trend in working life expectancy is positive, gender differences persist. Despite women experienced a substantial increase in employment, gender gaps remain large, particularly in the southern regions. Further examination of retirement trends underscores the complex relationship between gender, region, and the duration of retirement. The study concludes that policy efforts aimed at guaranteeing the financial viability of the pension system should focus not only on increasing the retirement age but also investing in employment opportunities, particularly for women and individuals living in the southern regions. Considering the diverse employment trajectories of individuals, especially in relation to gender and regional differences, is essential for ensuring the effectiveness and fairness of initiatives addressing population aging. Investing in women’s employment would help promote gender equality and reduce the underutilization of human capital.
Keywords: working life expectancy, gender, italian regions, Sullivan method, population aging.
Riassunto. Mentre le società di tutto il mondo affrontano le sfide poste dall’invecchiamento della popolazione, i sistemi pensionistici subiscono una crescente pressione. L’Italia, una delle maggiori economie europee e con una delle popolazioni più anziane, rappresenta un caso emblematico per analizzare la complessa interazione tra genere e disparità regionali nel contesto dell’allungamento della vita lavorativa. Lo studio sull’aspettativa di vita lavorativa nelle regioni italiane dal 2000 al 2016 evidenzia una tendenza generalmente positiva e mette in luce le dinamiche complesse della forza lavoro che invecchia. Sebbene la tendenza generale dell’aspettativa di vita lavorativa sia in crescita, permangono differenze di genere. Nonostante le donne abbiano registrato un aumento significativo dell’occupazione, i divari di genere rimangono ampi, in particolare nelle regioni meridionali. Un’ulteriore analisi delle tendenze pensionistiche evidenzia la relazione complessa tra genere, area geografica e durata della pensione. Lo studio conclude che gli interventi politici volti a garantire la sostenibilità finanziaria del sistema pensionistico dovrebbero concentrarsi non solo sull’innalzamento dell’età pensionabile, ma anche sugli investimenti nelle opportunità occupazionali, in particolare per le donne e per coloro che vivono nelle regioni meridionali. Considerare i percorsi occupazionali differenziati degli individui, soprattutto in relazione al genere e alle disparità territoriali, è fondamentale per assicurare l’efficacia e l’equità delle politiche che affrontano l’invecchiamento demografico. Investire nell’occupazione femminile contribuirebbe a promuovere l’uguaglianza di genere e a ridurre la sottoutilizzazione del capitale umano.
Parole chiave: aspettativa di vita lavorativa, genere, regioni italiane, metodo di Sullivan, invecchiamento della popolazione .
Contents
2.1 Recent trends in Working Life Expectancy
4.1 Years of Life Expectancy in Employment, Joblessness and Retirement across Macro Area
Gender and regional differences in Expected years in Retirement
4.3 Gender and regional differences in expected years in Joblessness
1. Introduction
Welfare systems face the challenges posed by demographic changes, including longer life expectancies and fewer children. An increasing share of the elderly puts strain on the pension systems: on the one hand, the elderly receive pensions for more years; on the other hand, fewer working-age individuals contribute to the pension system. Increasing the retirement age is a common measure to reduce the financial burden on the pension system and ensure its sustainability in Western countries (Gruber, Wise 2009). Policy makers have attempted to raise the statutory age at retirement, often above age 65, to postpone pension receipt while contributing longer to the pension system.
Although increasing the age at retirement seems the easier way to counteract the consequences of an aging population, its implementation does not guarantee longer working lives (Dudel, Myrskylä 2017; Lorenti et al. 2019) nor the sustainability of the pension system. Indeed, extended working lives as a remedy to population aging implies that individuals work longer throughout their lives and not only at older ages (Lorenti et al. 2019). Moreover, at the individual level the consequences of working longer are uncertain. In fact, there is evidence that while extending one’s working life can be beneficial for both health and financial stability, these advantages are highly dependent on several factors. In particular, the quality of the job and the ability to maintain a healthy work-life balance are crucial in determining whether an extended working life will enhance or undermine overall well-being.
Despite population aging and its consequences on the labor market and pension system having been known for several decades and now widely recognized, research on the length of working life in Western countries and the factors affecting its variation has only recently started to grow. Italy is one of the largest European economies and one of the oldest countries in the world, characterized by significant disparities in its labor market across sociodemographic groups. The age at retirement is low (OECD 2023), and there are striking gender and geographical differences in labor force participation and employment opportunities (Marino, Nunziata 2017). Furthermore, there are disparities in health and life expectancy, with significant variations between genders and across different regions (Barbi et al. 2018; Moretti, Strozza 2022). Persisting geographical, gender and generational disparities in the labor market performance (Lorenti et al. 2019; Marino, Nunziata 2017; O’Higgins 2011), combined with those in health and life expectancy, make Italy an interesting case study as one of the countries where the impact of aging is most pronounced.
To assess how population aging affects the state of labor market and the sustainability of social security systems, we estimate the working life expectancy at age 50 and describe its trend from 2000 to 2016, by gender and across Italian regions. Despite working life expectancy is a descriptive measure, it provides insights into geographical and gender inequalities arising from the interplay between survival and labor market outcomes over time. Working life expectancy, also named the average duration of working life, worklife expectancy, or labor market life expectancy (Hoem 1977; Loichinger, Weber 2016; Lozano, Rentería 2019), indicates the residual number of years that individuals are expected to be working at a specific age (in this study at age 50). It is a measure that summarizes employment trajectories over the life course (Loichinger, Weber 2016; Lorenti et al. 2019), providing a concise measure of how disadvantages accumulate (Hayward, Lichter 1998; Lorenti et al. 2019).
The analysis of working life expectancy allows us to focus on the expected number of years in employment, particularly among women. In fact, despite some positive changes that occurred in the last decades, women still encounter difficulties in terms of job opportunities (Mussida, Picchio 2014) and often are expected to be the (only) family caregiver. Women’s employment is still very low, and the large gender gap in employment reflects deeper societal problems linked to prevalent gender inequalities across economic and social domains. We argue that the gendered structure of the Italian labor market is not only a cultural and institutional issue but also represents a significant cost that negatively affects women’s working life expectancy, especially in the Southern regions, with important implications for the overall sustainability of the pension system.
The paper is organized as follows. Section 2 presents background literature on working life expectancy and its determinants, namely life expectancy and employment rates. Section 3 presents the data. Section 4 outlines the methods. Section 5 describes the results, and Section 6 discusses our findings and concludes.
2. Background
2.1 Recent trends in Working Life Expectancy
Working life expectancy at age 50 has generally been rising since the mid-1990s across European countries, with more pronounced increases among women and substantial differences by education level (Loichinger, Weber 2016). Recent literature on working life expectancy highlights significant heterogeneity across demographic groups, with relevant geographical differences both between and within countries. In Germany, over the periods between 2006-08, 2011-13, and 2016-18, working life expectancy has increased for both men and women at age 18 (35.8–38.3 years for men, 27.5–34.0 years for women), as well as at age 50, (from 10.2 to 11.7 years for men, and from 7.8 to 10.5 years for women) (Tetzlaff et al. 2022). Dudel et al. (2023) found that older Eastern German women have longer working lives than older Western German women, which is most likely a legacy of the German Democratic Republic’s high female employment. In the UK, while life expectancy gains have called for a rise in the state pension age, the predicted increase in healthy working life expectancy has been modest, suggesting that extended working lives may not align with policy goals (Lynch et al. 2022). In Spain, in 2016 the expected years of employment at age 16 was 29.5 for men and 27 for women; during the period 1986-2016 women gained 13.6 years of employment, while men lost almost five years (Lozano, Rentería 2019). In Italy, in the period 2003 to 2013, working life expectancy decreased for men from 35.2 to 27.2 years and for women from 34.7 to 23.7 years, widening the gender gap to 3.5 years. (Lorenti et al. 2019). The most affected groups were women, young people, and individuals living in the South (Lorenti et al. 2019). Recent estimates show a recuperation, with women still lagging behind (Eurostat 2024a).
Socioeconomic factors and occupational class significantly influence working life expectancy (Solovieva et al. 2024), with manual workers and those in physically demanding jobs having shorter working lives due to higher rates of unemployment (Dudel, Myrskylä 2020) and disability retirement (Solovieva et al. 2024). These heterogeneous trends by country underscore the importance of ad-hoc policies to address the diverse challenges faced by different geographical areas and demographic groups in extending their working lives.
2.2 The Italian context
The length of working life at old ages depends on the remaining years spent in employment and on residual life expectancy. Significant geographical heterogeneity exists in both employment and survival at older ages by gender across Italian regions, yet surprisingly little is known about these patterns. This study aims to fill this gap in the literature by examining the intersection of gender and geographical disparities in working life expectancy through an analysis of recent trends across Italian regions. We begin with a review of the key components of working life expectancy, such as (a) survival trends and (b) employment rates.
a) Life expectancy and changes in mortality dynamics
Life expectancy at birth has steadily increased globally over the past two centuries, driven by progressive mortality reduction at all ages. Before 1950, this increase was primarily due to a significant drop in death rates among younger individuals. Afterwards, improvements in life expectancy were mainly driven by declining mortality among those aged 65 and older (Wilmoth 2000). As a result of these improvements, Italy has become one of the countries with the highest life expectancy in the world. However, this increase in life expectancy came together with gender disparities in survival, with women outliving men by more than four years in 2022 (in 2022, at the age of 65, women were expected to live approximately 21.9 years and men 18.9 years).
Gender gaps in life expectancy are sensitive to changes in mortality dynamics and amplified by cause-specific mortality structures (Caselli, Egidi 1991). Diseases of the circulatory system, such as heart disease and stroke, are leading causes of mortality, often serving as sentinel indicators of socioeconomic conditions in the country (Barbi et al. 2018), particularly among women in Italy, reflecting the impact of socioeconomic conditions on health outcomes. The economic and social disparities are reflected in the geographical distribution of mortality rates. In the north, men face higher cancer mortality due to occupational and lifestyle factors. In the south, women have higher cardiovascular disease mortality due to inadequate healthcare and lower education and economic independence (Barbi et al. 2018). Such factors are reflected in life expectancy differences across regions.
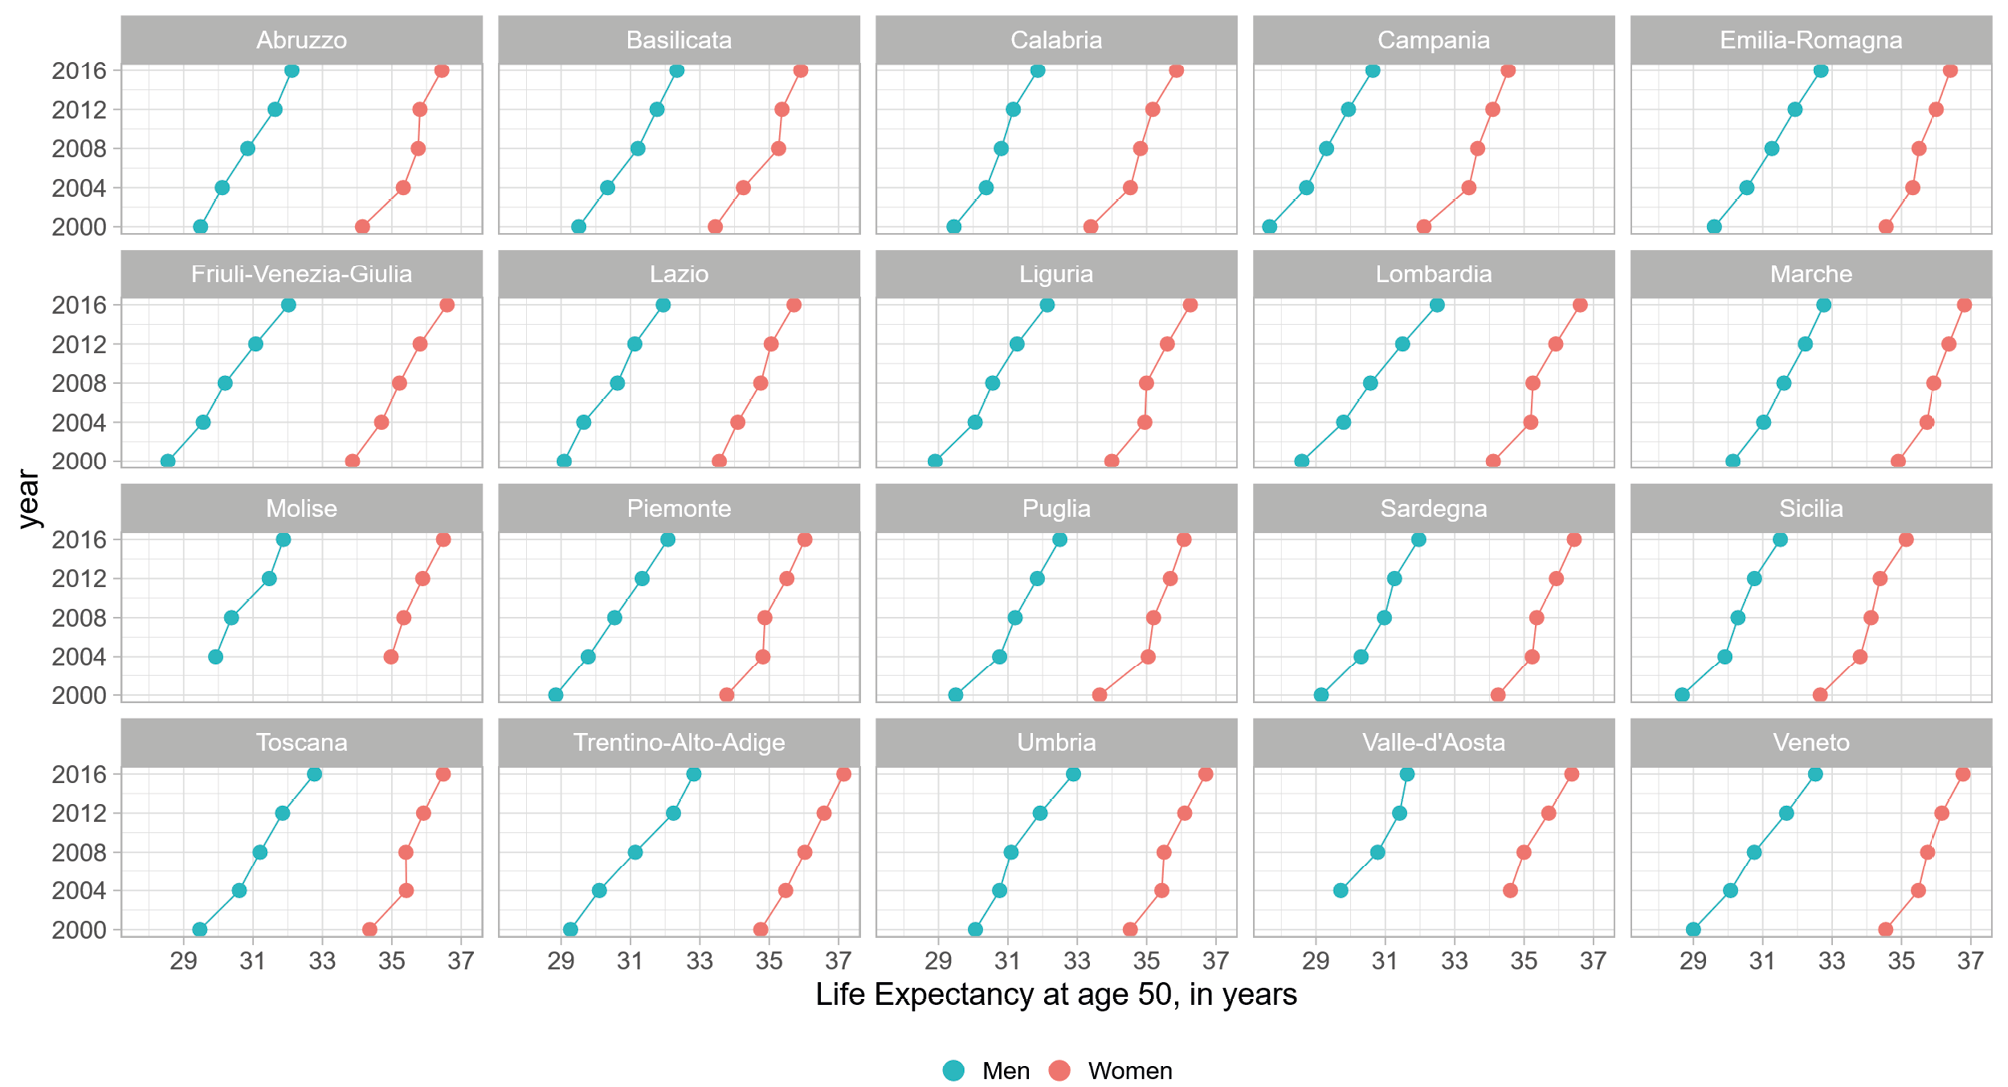
Despite life expectancy at age 50 has shown a steady increase for both genders across Italy, with average gains of 2.3 years for women and 3 years for men (Fig. 1), regional disparities by gender remain. In 2016, men in Campania had the lowest residual life expectancy (at age 50) of 30.6 years, compared to 32.8 years in Marche. Similarly, at the same age women in Campania had the shortest residual expectancy of 34.5 years, while those in Trentino – Alto Adige lived the longest, 37.1 years. For both genders, the rate of improvement in life expectancy slowed down, particularly around 2008 during the Great Recession.
Regional differences in survival, combined with fertility trends and internal migration, have led to significant variations in the population structure across Italian regions. While the overall trend is toward population aging, substantial differences exist in the proportion of elderly individuals across regions and genders. For example, in 2022, 23.8 percent of the Italian population was aged 65 and older. The highest percentage of elderly people was recorded in Liguria at 28.9 percent, with the highest old age dependency ratio of 47.8. The lowest percentage was in the “provincia Autonoma di Bolzano” at 20 percent, with an old age dependency index of 31.1, which was higher only than the corresponding index for Campania (30.6).
In short, an individual’s place of residence and environment plays a fundamental role in shaping their lives, health and lifespan. Factors such as healthcare accessibility and quality, environmental conditions, societal norms, and the labor market contribute to this influence (Wilkinson et al. 2003). Lastly, the job opportunities available to an individual might influence their mental and physical health, with high-stress jobs and unstable markets contributing negatively. Thus, the interplay between healthcare, environmental, social, and employment factors shapes an individual’s life expectancy. Therefore, when analyzing the relationship between life expectancy and labor market outcomes, it is important to appropriately distinguish the impact of geographical context on both health and employment opportunities.
b) The wasted capital: gendered employment trends across Italian regions
Over the past few decades, there has been a notable increase in female labor force participation across Western countries (Hochschild, Machung 2012), driven by higher educational attainment and changing societal norms (England 2010). However, the gender gap in employment in Italy remains substantial. In 2023, Italy recorded one of the lowest employment rates in Europe, with only 66.3 employed persons per 100 in the age group of 20-64 (Eurostat 2024b). This low national employment rate masks an even greater underutilization of human capital, particularly pronounced in the Southern regions and among women. Gender disparities persist in various labor market outcomes, including employment rates, wages, and occupational segregation, with women experiencing higher levels of underemployment compared to men (OECD 2019a). Among individuals aged 20-65, the gender employment gap is nearly 20 percentage points (76.0 % and 56.5%, respectively).
Despite facing various challenges, Italy has seen a steady increase in women’s participation in the labor force. This rise has largely been marked by an increase in involuntary part-time work and the prevalence of fixed-term contracts. Additionally, changes in retirement age have impacted the employment of women aged 55 and older (OECD 2019b). While flexible work arrangements can effectively boost women’s labor market participation, they often contribute to gendered labor market segregation (Barbieri et al. 2019), which in turn results in wage penalties for women (Bardasi, Gornick 2008). Women with temporary contracts, particularly younger ones, experience higher levels of job insecurity compared to those with stable employment. This insecurity affects other domains of individuals’ lives, making the transition to adulthood and family planning – especially fertility intentions – more challenging (Bonanomi, Rosina 2022; Busetta et al. 2019; Vignoli et al. 2016).
These disparities reflect long-standing structural differences between regions (OECD 2019c), particularly in employment and economic performance, with northern regions generally outperforming southern regions in terms of job opportunities, wages, and productivity, irrespective of the life stage of individuals. Additionally, policies for gender equality and employment differ widely among regions, with fragmented legislation and varying effectiveness in implementation. For example, fiscal decentralization, has been shown to increase female labor supply by expanding municipal services like nursery schools, thereby reducing the gender gap in employment (Bianchi et al. 2023). The geographical distribution of such services clearly favors the most efficient regions (e.g., see the distribution of nursery schools in ISTAT 2020), leaving the southern regions at a greater disadvantage.
The gender gap in employment persists in older age groups and follows the traditional regional north-south gradient. Despite the growth in older people’s labor market participation, Italy still has a high inactivity rate among people aged 50-64 compared to the Euro area, especially among women (OECD 2019b), in the South, where employment opportunities are scarcer (Töpfer 2020). Trends in employment rates for men and women from 2004 to 2020 highlight a growing divide across regions, with the North-South disparity becoming especially pronounced for women (Fig. 2).
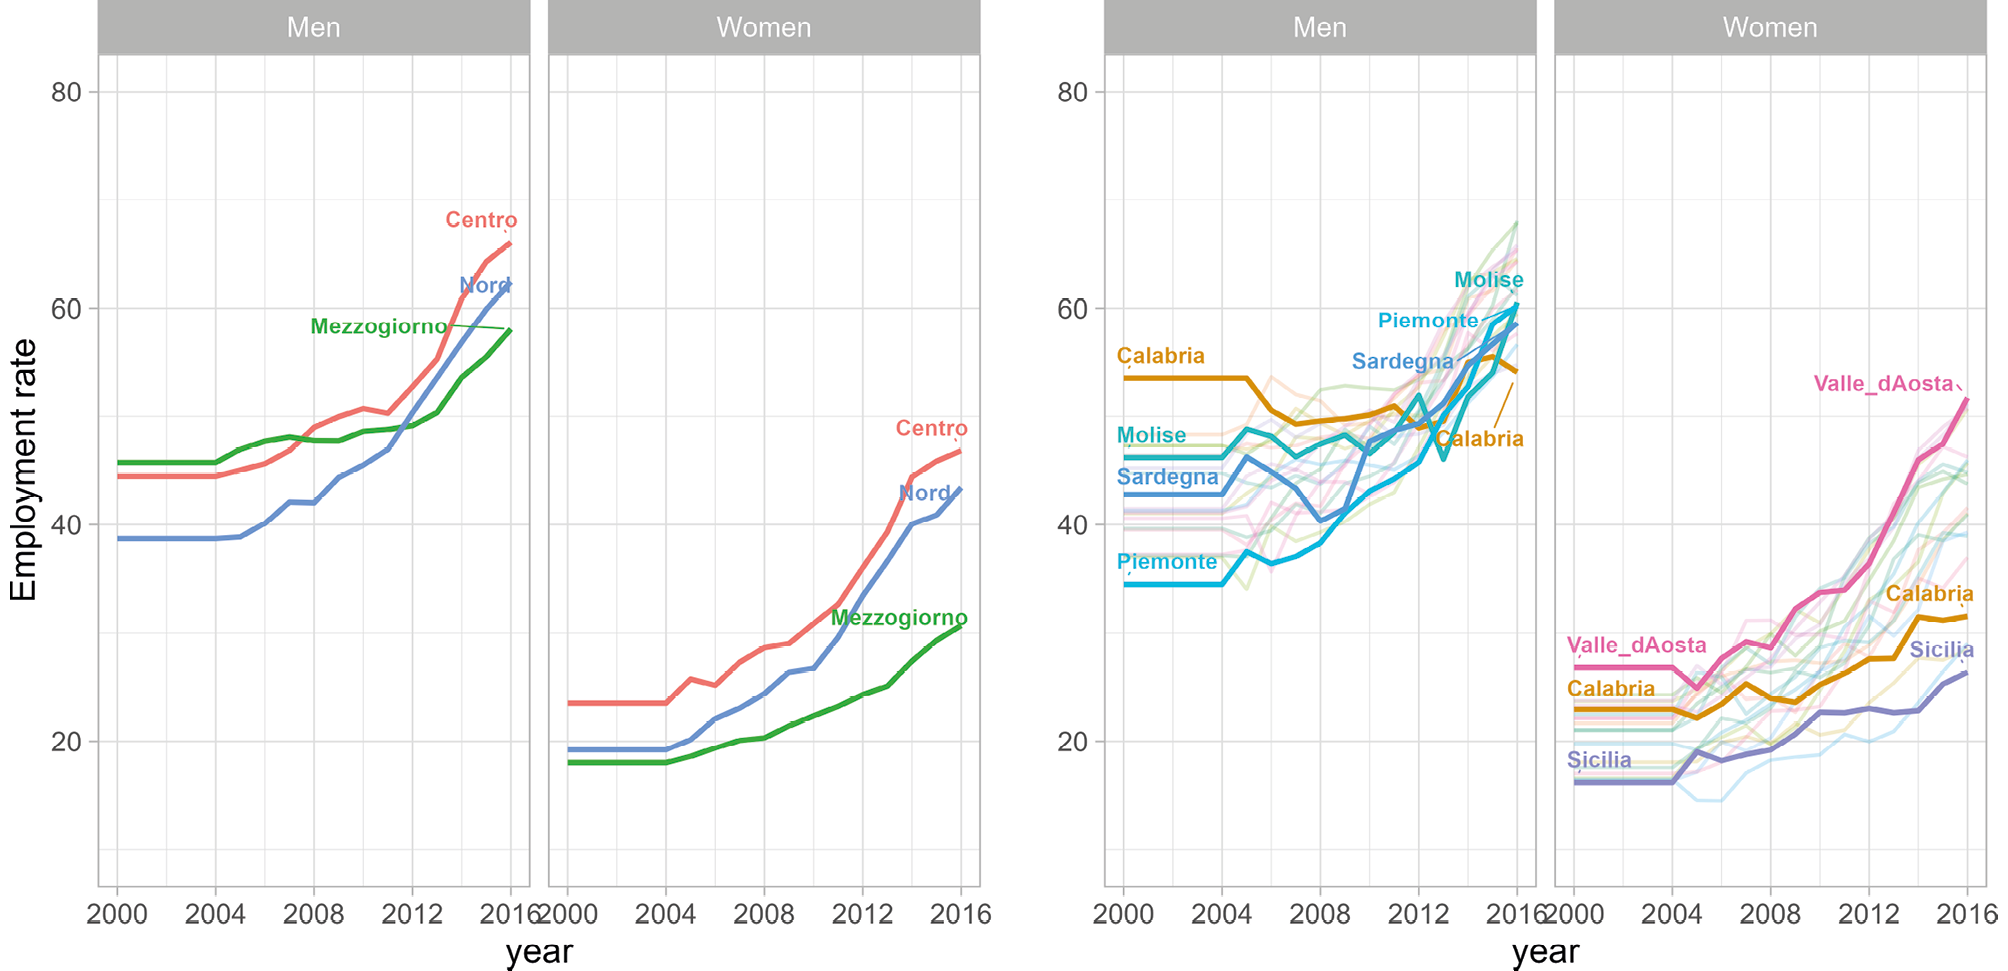
While the North has traditionally outperformed the South in labor market outcomes, the data for individuals aged 55-64 reveal notable exceptions in a more complex picture. At the start of the study period, some Southern regions reported relatively high employment rates for men. For instance, Molise saw men’s employment rates rise sharply from 46.2 per cent in 2004 to 60.6 in 2016, among the highest in the Southern regions. In contrast, Calabria, once leading the South with a 53.5 per cent male employment rate in 2004, experienced much slower growth, lagging by 2016. For women, despite a general upward trend, Southern regions like Calabria and Sicily showed significantly slower progress, deepening existing inequalities. All these insights underscore the complex and evolving nature of regional labor market dynamics, particularly in the context of gender disparities.
3. Methods and Data
3.1 Sullivan Method
In order to estimate gender and regional working life expectancy, we use the Sullivan method (Sullivan 1971). This method is an extension of the life table, and thus a descriptive demographic account. In this study, the Sullivan method is based on cross-sectional information: period life tables and prevalence in labor force statuses are combined to construct synthetic life-courses for the specified observation period(s). The computation of working life expectancy follows from the equation:
where a is the age interval, is a proportion of individuals in the labor force state j (employment1, joblessness and retirement) in the corresponding age interval a, is a number of survivors in the same age group a and is the number of person-years lived at in the age group a. To estimate the working life expectancy, we sum the total person-years in employment at age 50 and older. A similar approach is used to analyze complementary labor force states, such as joblessness and retirement, to obtain comparable measures expressed in life years. The total residual life expectancy at age 50 is the sum of the residual status specific expectancies. To derive these quantities, we need the distribution of the labor force states at ages a to . We estimate the share of individuals in each labor force state j by age, region, year, and gender using multinomial logistic regression models. The prevalence of labor force states is modeled as a function of age (grouped in five-year intervals), region (macro-areas for aggregate results), calendar year, and their interactions. The prevalence(s) are estimated for each gender by separate models, thereby implicitly interacting gender with all other variables.
where ηj = αj + βj,ageage + βj,regionregion + βj,yearyear + βj,reg_yearregion×year.
We use multinomial models to estimate the smooth prevalence of labor force statuses, thereby reducing the fluctuations that would otherwise result from non-parametric estimates. Consequently, the models include covariates representing the key dimensions of the corresponding non-parametric estimates, namely age, region and period (and implicitly gender). Confidence intervals are obtained through non-parametric bootstraps resampling the data 500 times.
3.2 Data
We use data from the Survey on Household, Income, and Wealth (SHIW), which is conducted by the Bank of Italy2. SHIW is a survey representative of the population resident in Italy, and as such, it does not include people living in institutions. Data is collected biennially, in waves that include a panel household component. Each wave includes approximately 8,000 households, comprising around 20,000 individuals. The survey collects information about individuals, their households, and properties they own. The survey provides a rich data source on income, labor force status, expenses, savings, family wealth, and other specific financial areas. The survey includes the most relevant socio-demographic information, such as age, gender education, and family composition, and covers some info on family of origin. We leverage information on labor force status over the years 2000, 2004, 2008, 2012 and 2016.
The outcome is an indicator of an individual’s self-reported labor force status, categorized into four distinct groups: employment, unemployment, inactivity3, and retirement. Age, gender, region of residence and survey year are the covariates used for modeling the labor force state prevalence. We estimate the prevalence of labor force status by age, using five-year age groups to minimize fluctuation (50-54, 55-59,…, 100+). The obtained age distributions align with those in the regional life tables4. We include dummy variables for the region of residence, survey years and their interaction. This is done to account for the differences in labor market conditions across these regions and the differential region-specific changes over time. Models are stratified by gender as the labor market trajectories of individuals are highly gendered, and thus implicitly interacting gender with all the variables in the models.
3.3 Analytical sample
Table 1 presents summary statistics for the analytical sample, by gender. The dataset includes over 45 thousand individuals spanning the years 2000 to 2016, with 8,500 individuals sampled in 2000 and 9,300 in 2016. Women are slightly overrepresented, accounting for approximately 53 percent in each of the considered years. The regions with the highest share of individuals are Lombardy, Piedmont, and Campania, which together account for 30 percent of the entire sample. In contrast, the least represented regions are Val d’Aosta, Molise, Basilicata, and Trentino – Alto Adige. One third of the male sample was employed, while only one sixth of the female sample was employed. However, there is an observable upward trend in the proportion of employed women over the years. Retirement is the most common status, with nearly two-thirds of men and over half of women retired.
| Women | Men | |||||||||
|---|---|---|---|---|---|---|---|---|---|---|
| 2000 | 2004 | 2008 | 2012 | 2016 | 2000 | 2004 | 2008 | 2012 | 2016 | |
| N | 4,459 | 4,774 | 4,813 | 5,175 | 5,102 | 3,996 | 4,085 | 4,123 | 4,503 | 4,212 |
| Region | % | % | ||||||||
| Piedmont | 9.5 | 9.1 | 10.7 | 8.3 | 8.3 | 9.3 | 9.0 | 10.4 | 8.2 | 7.6 |
| Val d’Aosta | 0.2 | 0.4 | 0.4 | 0.4 | 0.4 | 0.4 | 0.4 | 0.5 | 0.4 | 0.5 |
| Lombardy | 10.1 | 10.1 | 10.4 | 10.4 | 10.4 | 9.9 | 10.6 | 11.2 | 10.9 | 10.7 |
| Trentino – Alto Adige | 1.7 | 1.8 | 1.7 | 2.0 | 3.0 | 2.0 | 1.8 | 1.8 | 1.8 | 2.5 |
| Veneto | 5.5 | 7.0 | 6.6 | 5.9 | 5.8 | 5.3 | 7.0 | 6.7 | 6.3 | 6.5 |
| Friuli | 3.7 | 3.2 | 2.9 | 2.1 | 2.1 | 3.5 | 3.1 | 3.0 | 2.3 | 2.7 |
| Liguria | 3.9 | 4.6 | 3.9 | 3.8 | 3.6 | 4.0 | 4.2 | 3.9 | 3.8 | 3.5 |
| Emilia Romagna | 8.1 | 7.2 | 8.4 | 8.2 | 7.3 | 8.7 | 7.6 | 8.7 | 8.5 | 7.6 |
| Tuscany | 8.1 | 8.5 | 8.6 | 8.2 | 7.8 | 8.8 | 8.4 | 7.9 | 7.9 | 7.8 |
| Umbria | 4.0 | 4.1 | 3.8 | 3.7 | 3.7 | 3.6 | 4.0 | 3.8 | 3.8 | 4.0 |
| Marche | 4.7 | 5.7 | 5.2 | 4.9 | 4.9 | 4.4 | 5.8 | 4.7 | 4.7 | 5.1 |
| Lazio | 4.4 | 5.1 | 4.9 | 5.2 | 5.8 | 4.9 | 5.0 | 5.1 | 5.7 | 5.6 |
| Abruzzo | 3.5 | 3.0 | 2.6 | 2.6 | 2.7 | 3.4 | 2.9 | 2.6 | 2.6 | 2.6 |
| Molise | 1.3 | 1.5 | 1.7 | 1.7 | 1.6 | 1.1 | 1.4 | 1.9 | 1.7 | 1.7 |
| Campania | 10.2 | 7.4 | 7.7 | 9.4 | 9.4 | 9.8 | 7.1 | 7.3 | 9.2 | 9.7 |
| Apulia | 5.7 | 5.8 | 5.7 | 6.4 | 5.6 | 5.9 | 5.6 | 5.5 | 6.0 | 5.6 |
| Basilicata | 1.2 | 1.4 | 1.4 | 1.7 | 1.8 | 1.4 | 1.6 | 1.5 | 1.6 | 1.5 |
| Calabria | 2.9 | 2.7 | 2.6 | 2.7 | 2.8 | 2.8 | 2.8 | 2.7 | 2.7 | 2.5 |
| Sicily | 7.1 | 6.9 | 5.9 | 7.4 | 8.2 | 7.2 | 7.4 | 6.1 | 7.3 | 7.7 |
| Sardinia | 4.1 | 4.4 | 4.8 | 5.0 | 4.7 | 3.7 | 4.2 | 4.6 | 4.5 | 4.6 |
| Labor Force Status | ||||||||||
| Employed | 12.6 | 14.1 | 16.6 | 18.6 | 20.6 | 32.7 | 30.6 | 31.2 | 33.2 | 32.9 |
| Unemployed | 29.9 | 26.8 | 23.1 | 24.1 | 20.6 | 0.1 | 0.2 | 0.2 | 0.2 | 0.3 |
| Inactive | 0.5 | 0.8 | 1.1 | 1.7 | 2.1 | 2.8 | 2.7 | 2.1 | 4.2 | 6.0 |
| Retired | 57.0 | 58.4 | 59.1 | 55.6 | 56.7 | 64.4 | 66.6 | 66.5 | 62.4 | 60.9 |
4. Results
The results of the Sullivan method allow us to describe levels and trends in working life expectancy, by gender and region.
4.1 Years of Life Expectancy in Employment, Joblessness and Retirement across Macro Area
In Figure 3, residual life expectancy at age 50 is decomposed into shares of expected years in Employment (WLE), Joblessness (JLE) and Retirement (RLE), thereby summarizing levels and trends observed across macro areas, simplifying the overall interpretation. The estimates clearly show a significant gap in women’s employment, particularly pronounced in the South. In 2016, women aged 50 in Southern Italy could expect to spend just over 11% of their remaining life in employment, about 33% in joblessness, and more than 56% in retirement. In contrast, their counterparts in Northern Italy spent about 22% of their remaining life in employment, over 16% unemployed, and roughly 62% in retirement.
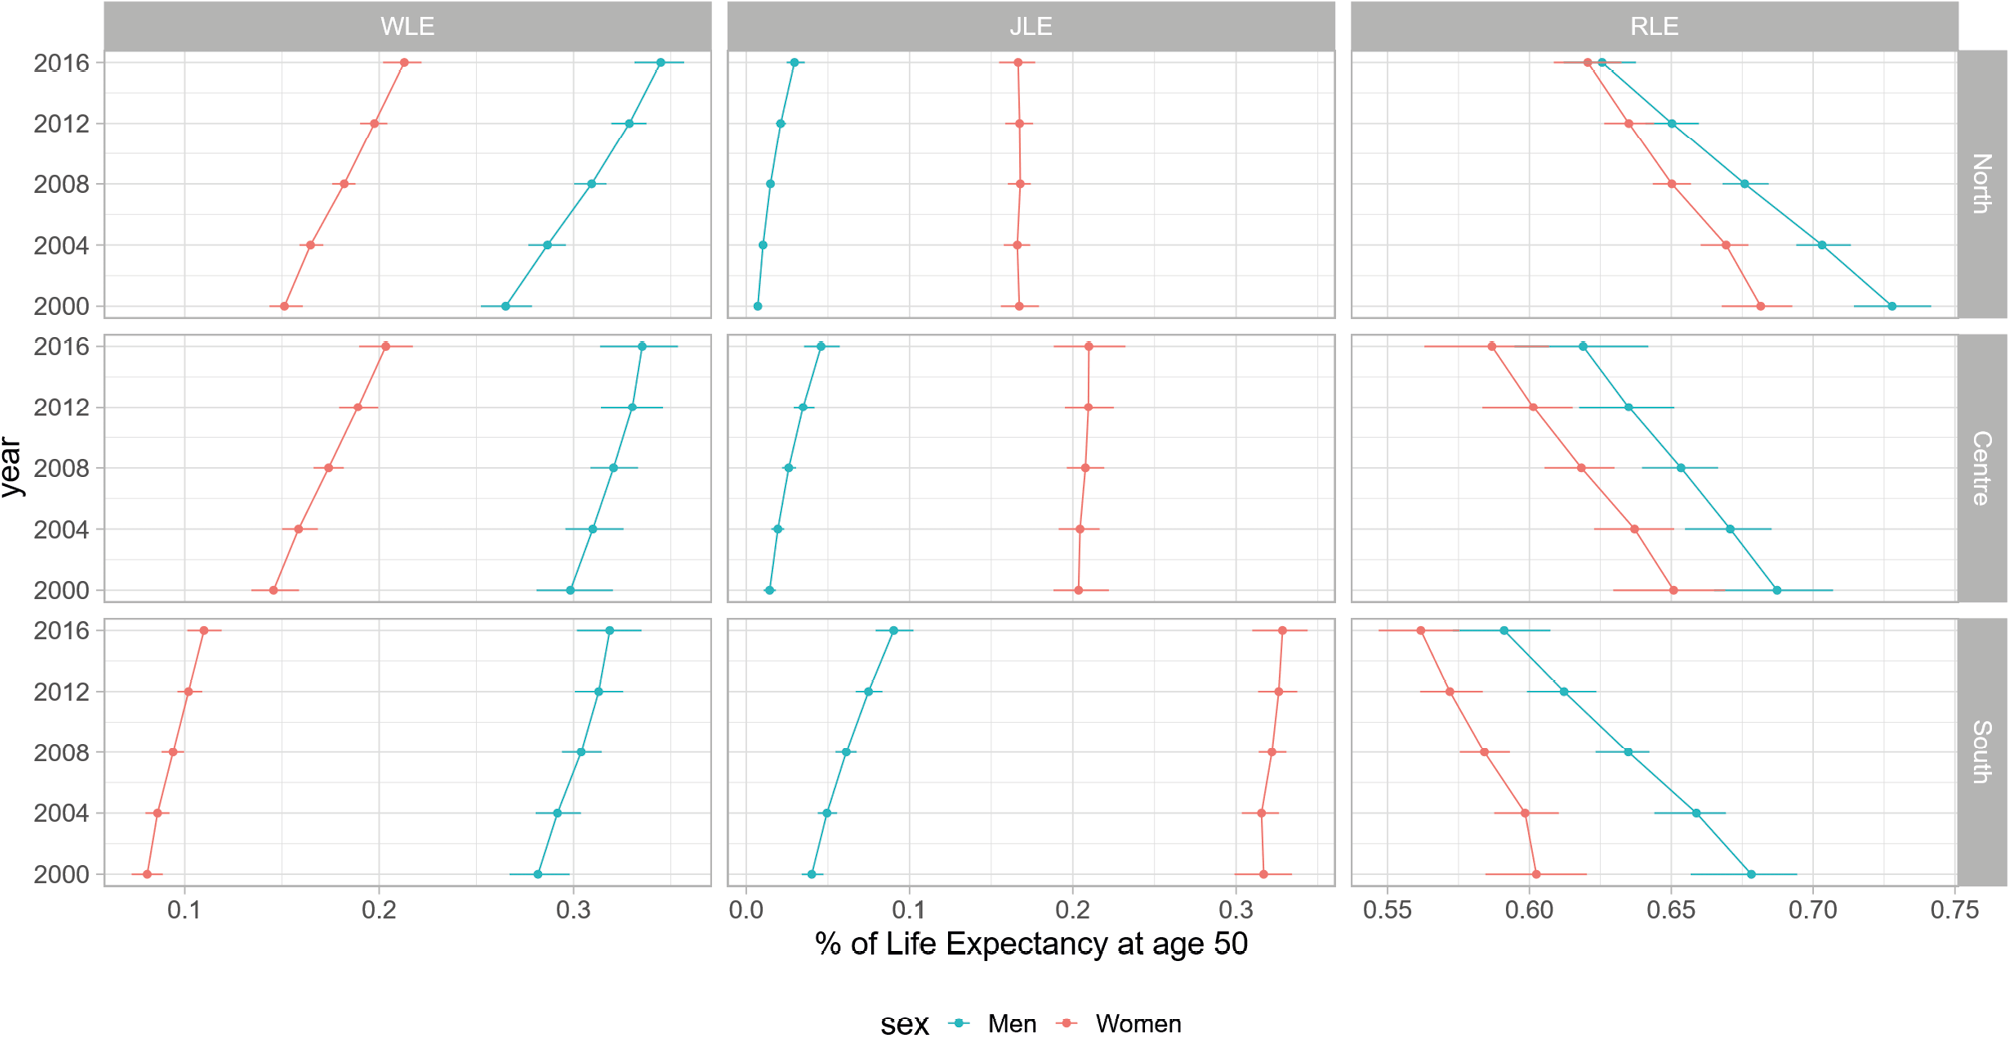
Examining trends from 2000 to 2016 reveals a consistent increase in working life expectancy relative to overall life expectancy, regardless of gender or macro-area. Nevertheless, in the northern and central regions, the relative increase in years of employment was much more pronounced than in the southern regions, with no doubt that the increase is due to better employment conditions. In fact, despite the differences in life expectancy at age 50 are not large, the northern and central regions recorded a survival advantage of around one year in 2016, irrespective of gender. These results are reinforced by the complementary measure of the expected years in retirement and joblessness. While relative retirement life expectancy decreased from 2000 to 2016 in all the macro area, joblessness life expectancy increased in the southern regions, particularly for men. The northern and central regions recorded a slight increase in the joblessness life expectancy of men. Overall, the results support the view that in the period from 2000 to 2016, working life expectancy increased across all macro-area. In the southern regions, the growth in working life expectancy was weaker, and the years of reduction in retirement life expectancy were accompanied by more years in JLE than in the rest of Italy.
4.2 Working life Expectancy
Figure 4 shows the working life expectancy trajectories relative to the remaining life expectancy at age 50, by gender, across different Italian regions5. Relative working life expectancy indicates the proportion of remaining life expectancy to be spent in employment, making working life expectancy a useful indicator for evaluating whether working life years are increasing (decreasing) faster or slower than overall life expectancy.
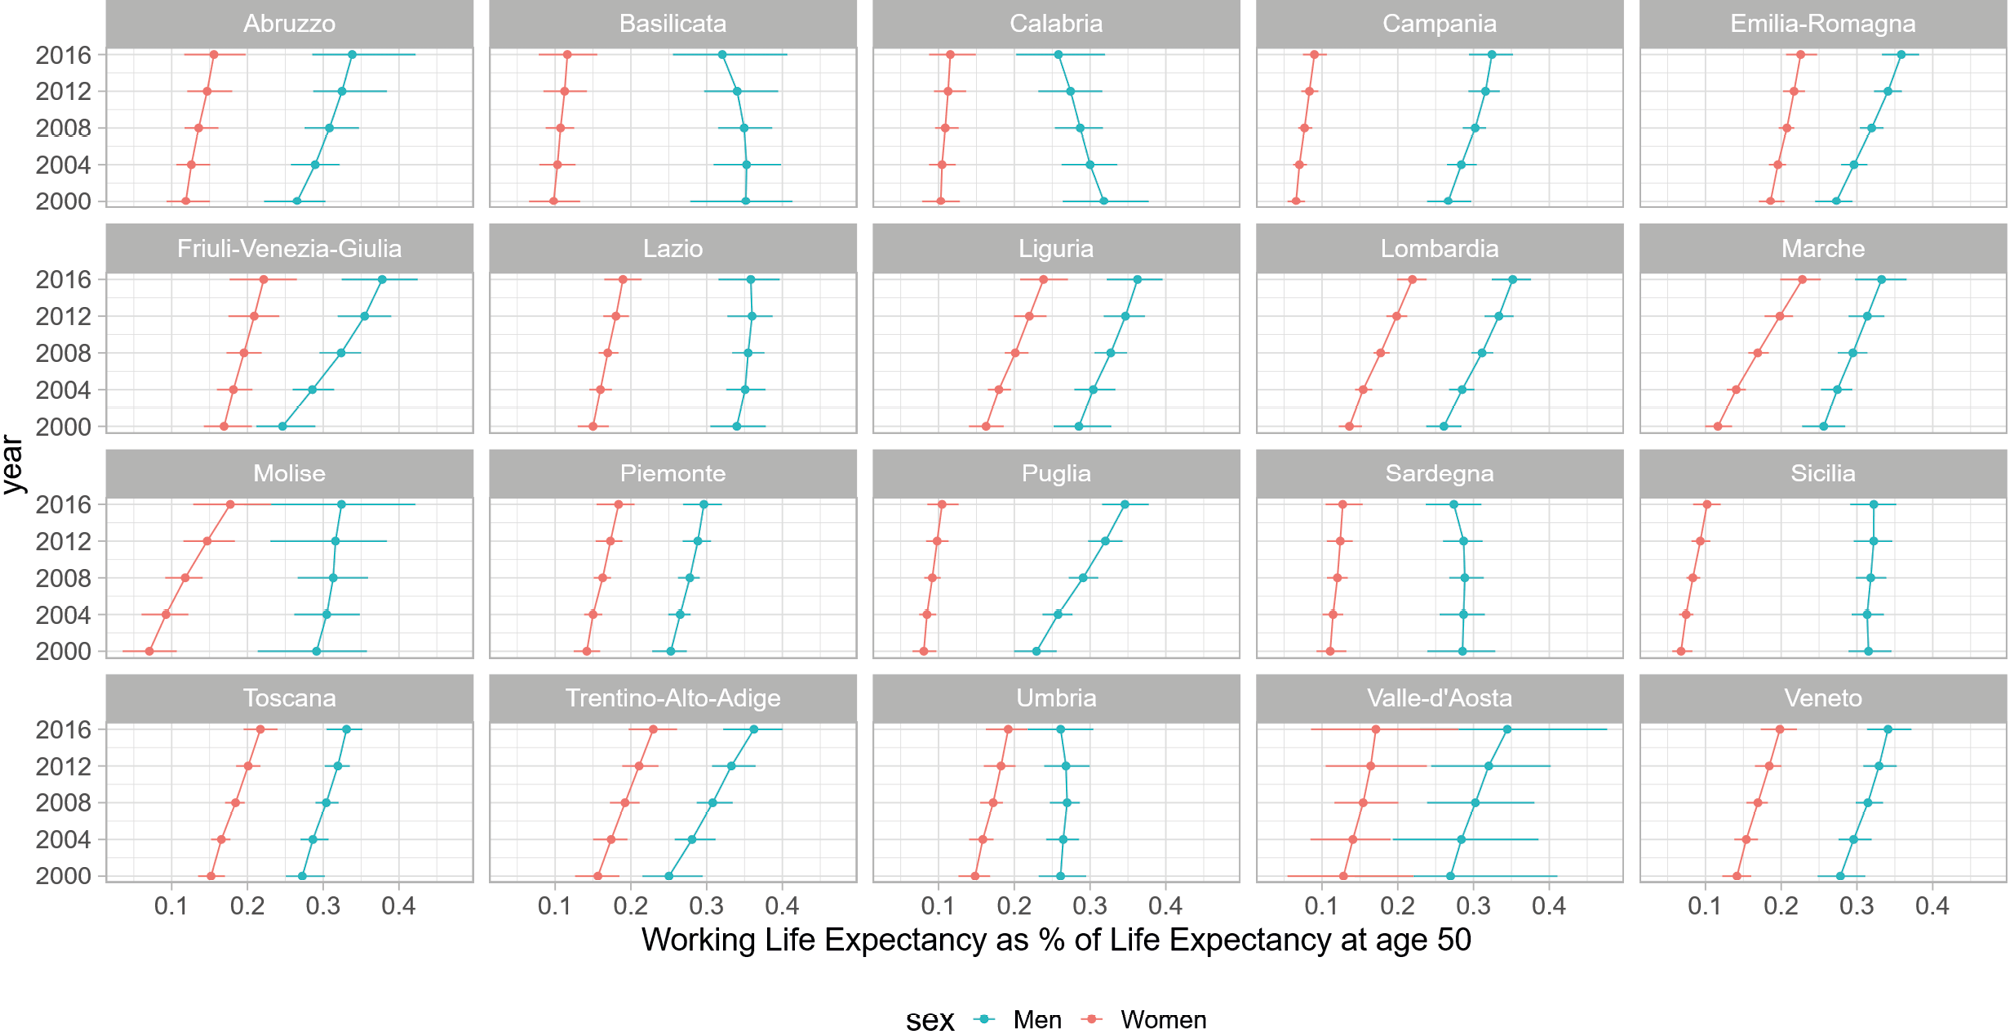
Working life expectancy is higher for men than for women across all regions. Overall, working life expectancy shows an upward trend regardless of gender or region, although there are some notable exceptions. For instance, for men in Calabria, Basilicata and Umbria, years spent in employment relative to life expectancy have decreased, while remaining relatively stable for men in Lazio and Sicily. For women, the growth in working life expectancy is generally consistent across regions, although more pronounced in regions such as Lombardy, Marche, and Tuscany. In regions like Sicily, Campania, Basilicata, and Calabria, where the initial working life expectancy levels were low, the increase was less pronounced, only slightly larger than the corresponding increase in life expectancy.
In 2000, the lowest working life expectancy at age 50 was recorded among men in Apulia, 6.8 years, and among women in Campania, with less than 2 years. Such results imply that, in 2000, men in Apulia could expect to work less than a quarter of their remaining life at age 50, while women in Campania spent only about 6.5 percent of their remaining life (at age 50) at work. On the other hand, in the same year the highest working life expectancy for men was recorded in Basilicata, 10.4 years, while for women, in Emilia Romagna, 6.1 years – representing 35.5 per cent and 18 per cent of their respective life expectancies. Overall, in 2000, individuals aged 50 could expect to spend much less than one-third of their remaining life expectancy if men and less than one-fifth of women. Importantly, gender disparities were large: the longest life expectancy for women remained shorter than the shortest life expectancy for men.
The following decade saw a more rapid increase in women’s employment compared to men, alongside a corresponding slower rise in life expectancy. This shift influenced the overall working life expectancy, still marked by significant gender differences across Italy’s regions. In 2016, the longest working life expectancy for men was recorded in Friuli Venezia Giulia (12.1 years), while for women, it was recorded in Liguria with 8.6 years. Compared to 2000, both genders experienced an increase in working life expectancy, but the absolute difference remained at around 4 years. The corresponding proportion of working life relative to remaining life expectancy was 38 per cent for men and 24 per cent for women, indicating a more pronounced increase for women than for men. However, challenges remain, particularly for women in regions like Campania, where working life expectancy was just 3.1 years in 2016, accounting for less than 10 percent of their remaining life at age 50. Similarly, in 2016, the lowest working life expectancy for men was in Calabria at 8.2 years, which represented 26 percent of their remaining life.
Gender and regional differences in Expected years in Retirement
While the gendered patterns in working life expectancy show notable consistency across Italian regions, the duration of retirement varies significantly based on gender, as illustrated in Figure 5.
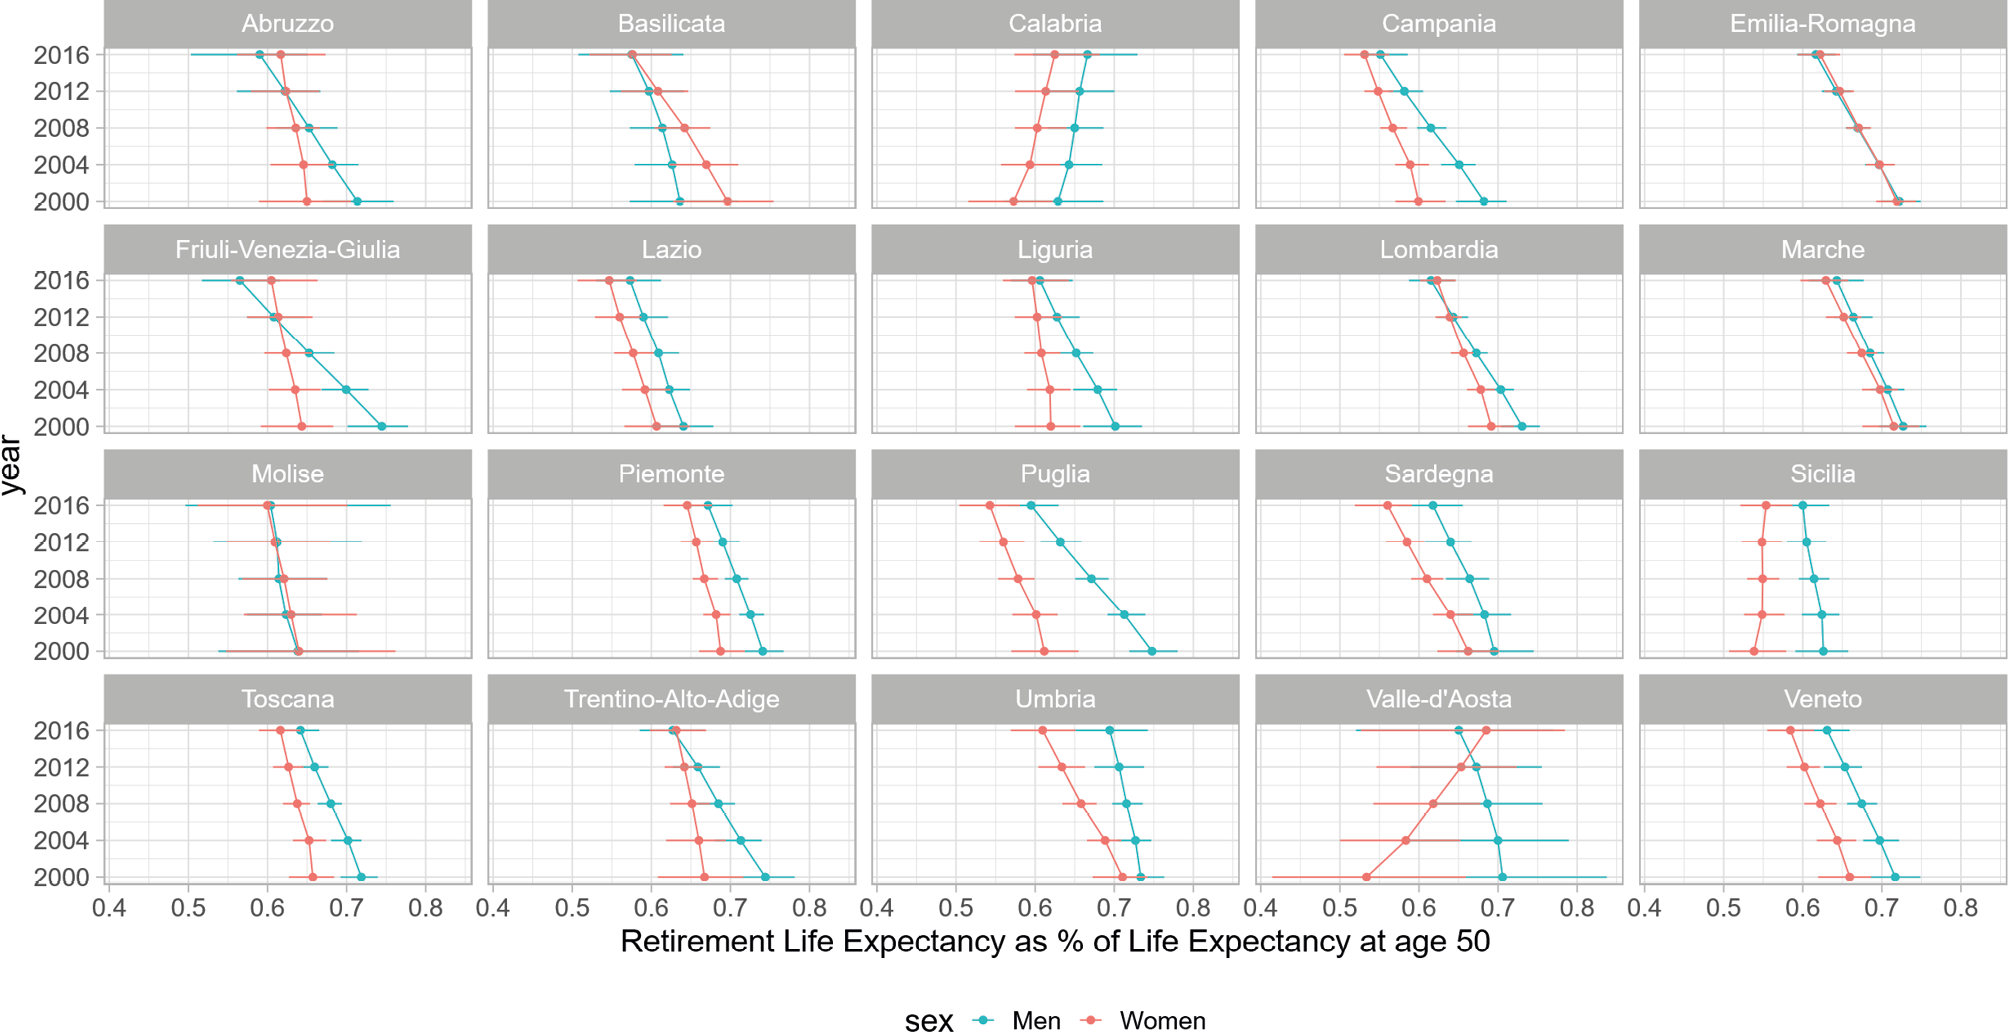
For women, most regions present a trend suggesting a reduction in the number of retirement years relative to life expectancy. However, regions like Calabria and Sicily exhibit the opposite trend, with an increase in the expected retirement years relative to life expectancy. It’s important to highlight that, when accounting for sampling variation, these declining patterns in most regions overlap across years, therefore the decline is statistically not significant. A similar trend is observed among men. Calabria and Sicily show the most distinct pattern: the number of retirement years relative to life expectancy increases in Calabria, irrespective of gender, and appears stable in Sicily.
There are instances of gender cross-over, such as in Abruzzo, Basilicata, or Friuli Venezia Giulia, and convergence, as observed in Liguria, Lombardy, and Molise. This implies that, in certain regions, men are expected to spend either less or the same amount of time in retirement as women, relative to their life expectancy. While this may seem counterintuitive given that women generally live longer than men, women have increased their workforce participation and now experience longer working lives, many still face unemployment or have engaged in full-time unpaid domestic work. Such changes suggest that those with more fragmented careers may not have accumulated enough contributions to retire at statutory retirement ages. Under those circumstances, women spend a relatively greater number of years in joblessness compared to men before eventually retiring.
4.3 Gender and regional differences in expected years in Joblessness
Patterns of Joblessness show a clear gender divide across Italian regions, with women consistently spending more years in joblessness than men with no exception, as shown in Figure 6.
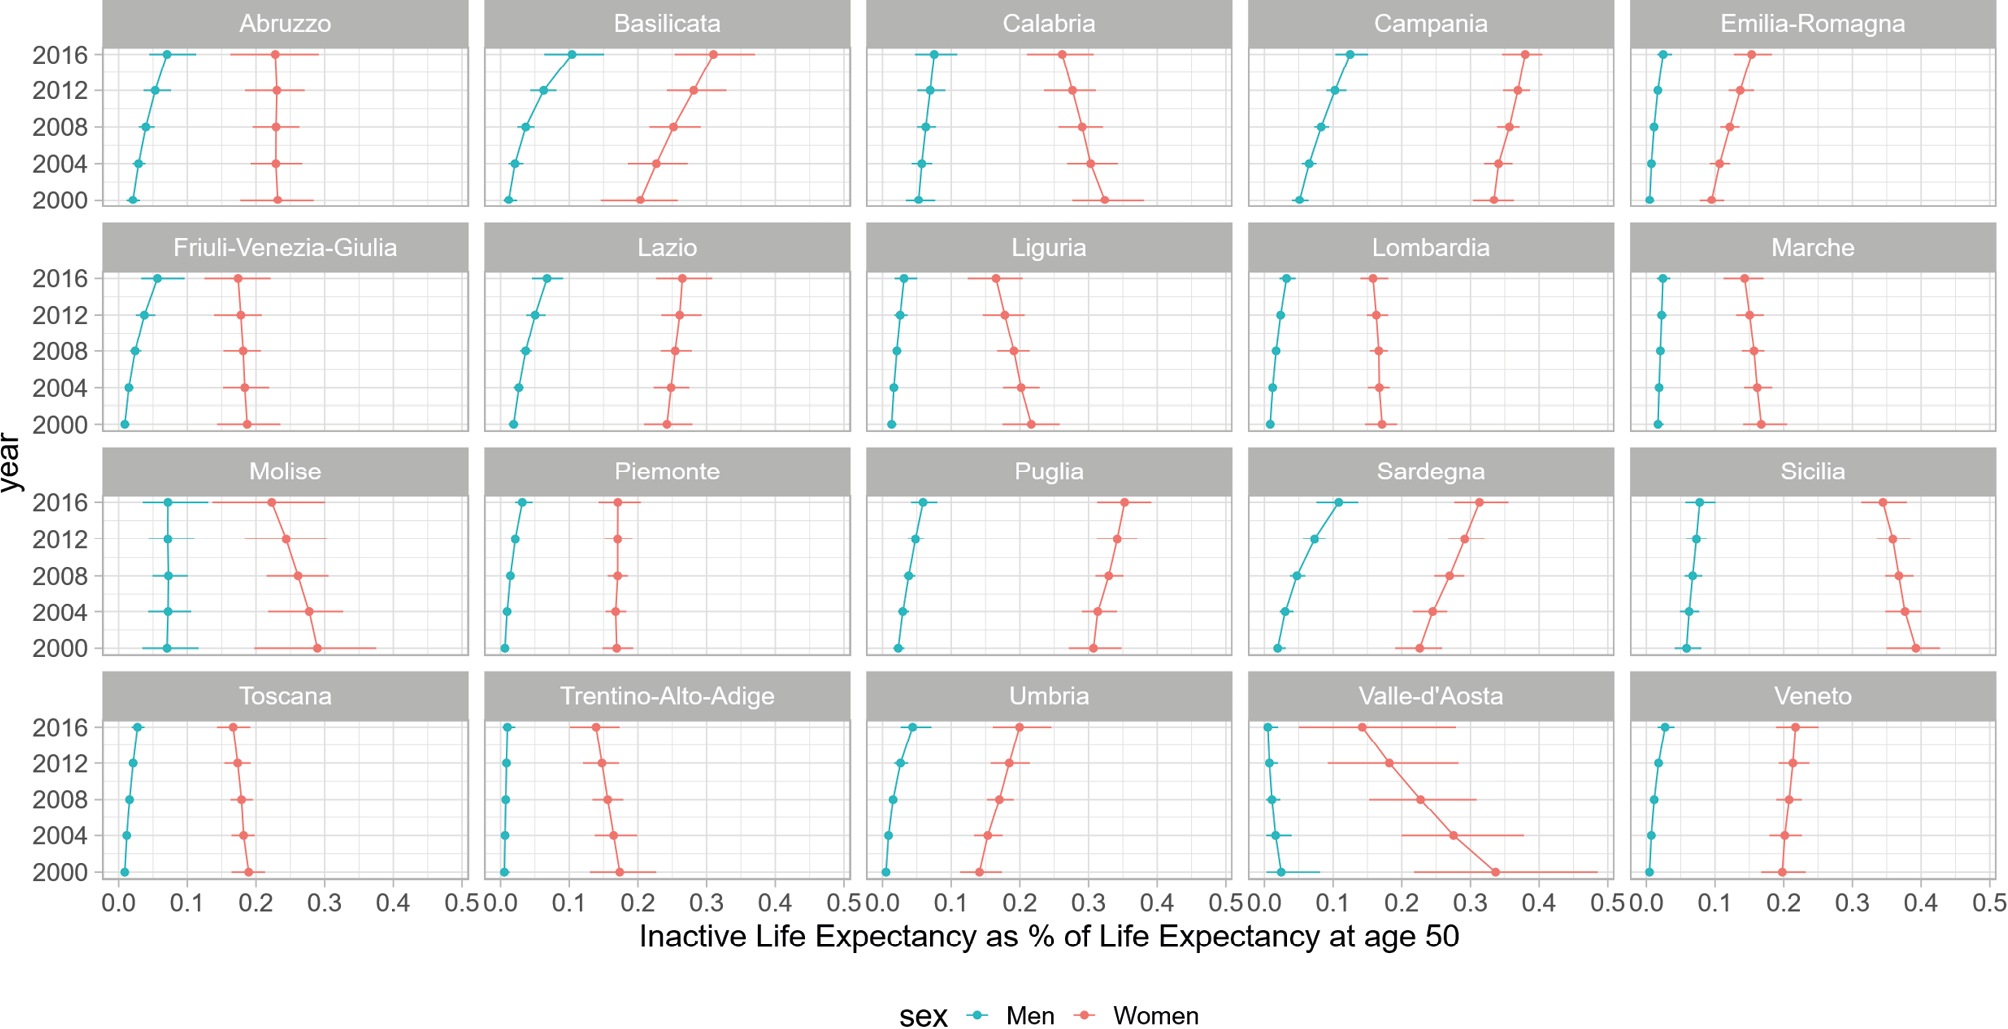
Nevertheless, trends over time reveal distinct patterns in many regions. For instance, in Calabria, Liguria, Molise, Sicily, and Tuscany, the expected years of joblessness relative to residual life expectancy decline for women, while increase for men. In contrast, regions like Basilicata, Campania, Lazio, Apulia, Sardinia, Umbria, and Veneto, show an increasing rise of years in joblessness for both men and women. Sicily and Campania have the highest proportion of years in joblessness for women, around 40% of their remaining life at age 50. For men, Sicily and Campania again stand out, with around 10% of their remaining life expectancy at age 50 spent in joblessness.
It is worth remembering that such proportion should be read together with the proportion of years in employment and in retirement. A very low proportion of years in joblessness could reflect either long working lives, or expected retirement years, or both. These patterns result from the complex interplay between labor market circumstances and survival with gender and geography and cannot be captured through different measures, regardless of their complexity.
5. Discussion and Conclusions
In recent decades Western countries have implemented policies aimed at extending working life to ensure the sustainability of pension systems. Pension rules determine the official retirement age at the national level, but individual and contextual factors – such as continuity in employment, health, and survival – play a crucial role in shaping when people enter and exit retirement. By summarizing individuals’ employment experiences in later years through working life expectancy, we offer a perspective that captures the complex relationship between labor market outcomes, and life expectancy. This perspective is important because it captures the differential impact of economic activity and survival, enabling comparisons from both gender and regional perspectives. Our results show a general increasing trend in working life expectancy, both in the absolute number of years and in relation to progress in life expectancy at age 50. Our estimates of working life expectancy at age 50 reveal large differences between regions and genders, as well as variability in how additional years of life have been distributed between years of joblessness, and retirement. Women at the age of 50 still face a gender gap, which is widening in many regions.
In 2000, the longest working life expectancy for women in Emilia Romagna still fell short of the shortest working life expectancy for men in Apulia. By 2016, despite improvements, the absolute difference in working life expectancy between men and women remained around four years. This highlights the persistent gender gap in employment, which may be influenced by factors such as labor market discrimination, lack of policies for work-family reconciliation, particularly those aligning parents’ and children’s schedules (such as childcare services or full-time schooling), persisting unequal caregiving responsibilities at older ages, and differences in retirement policies. Our results indicate a reduction in the number of years spent in retirement relative to life expectancy for most women, except in regions like Calabria and Sicily. For men, the pattern is often reversed. Additionally, women consistently spend more years in joblessness than men, although trends over time vary by region. Reading together the results, we can learn about patterns that are region-specific. For example, while in Calabria and Sicily life expectancy increased irrespective of gender, for women most of the gained years of life were not followed by a proportional increase in employment years resulting in an increase in the duration of retirement years. Instead, in Sardinia the increase in life expectancy for women resulted in a stable share of years in employment with a decrease in retirement years and an increase in joblessness. These findings suggest that policies aimed at extending working life should not solely focus on raising the retirement age but must address the broader systemic inequalities that hinder labor market participation, particularly for women in disadvantaged areas.
Our findings at the regional level are challenging to compare with previous studies due to their specific contexts. Moreover, studies often focus on different time periods, age ranges, and definitions of working life expectancy. However, our aggregated results appear to be consistent with earlier research. In particular with the conclusions of Lorenti et al. (2019), which confirm gender differences in the duration of working life and geographical disparities. We provide additional insights by highlighting regional variations in working life expectancy, thereby enhancing our understanding of these previous results. For example, the apparent stable retirement years compared to life expectancy at the macro-area level hide different patterns and compositional differences at the regional level. Thus, the regional perspective reveals significant variations in the gendered patterns of working and retirement life expectancy, which are in line with what was observed in other countries. For instance, Dudel et al. (2023) found important differences in women’s working life expectancy between East and West Germany.
To provide a better context for the study, it’s important to note that, during the study period, working life expectancy has generally increased across most European countries, with women experiencing a more significant rise than men. However, despite this improvement, women still have fewer years of employment remaining compared to men. Various pension reforms were implemented in countries such as the UK, Germany, Spain, and Italy to encourage labor force participation among older individuals (OECD 2023). These reforms aim to extend the working life, thereby reducing the time spent on retirement and increasing the number of active contributors to the pension system. This shift also reflects stricter requirements for early retirement and disability pensions, making it more challenging for individuals to retire early without experiencing benefit reductions. Despite the overall trend of women working longer, this increase can be attributed mainly to higher participation rates among women in the labor market, rather than solely to pension reforms.
These reforms may have unintended consequences, exacerbating existing inequalities among older workers and neglecting the needs of disadvantaged groups. Older workers face various challenges in finding employment due to market dynamics and skills depreciation, retirement age limits, and the physical demands of certain jobs (OECD 2019a, 2022). Disadvantaged groups are at risk of long periods of unemployment before reaching retirement age. Health is crucial for maintaining employment at older ages. In the UK, policies aimed at extending working lives by raising the state pension age have shown some success; however, current projections indicate that gains in healthy working life expectancy may not keep pace with these policy changes (Lynch et al. 2022).
Generally, while life expectancy has increased, women still have a shorter healthy working life expectancy than men, which raises concerns about raising the pension age. In both Germany and Italy, women’s employment rates are lower than men’s, partly due to systems that do not help women’s employment. For instance, in Germany, the tax system incentivizes women to work part-time or leave the workforce, particularly affecting those with young children (Fasang et al. 2013). Women are more likely to exit the labor market to provide informal care and are less likely to return afterward. A similar situation is present in Italy. In both countries, challenges associated with reentering the workforce after childcare responsibilities stem from the insider-outsider dynamics of the labor market, which complicate their ability to regain employment. To support the reconciliation of family life and work in Spain, policies have been introduced allowing parents with young children to reduce their working hours, leading to an increase in part-time work among mothers. The labor reform of 2010 aimed to decrease duality and wage rigidity among workers; however, its impact has been limited, as the number of open-ended contracts has remained stable. These factors collectively contribute to gender disparities in work-life balance, which begin early and persist into later years.
The disadvantages faced by individuals at age 50 across different Italian regions represent just the tip of the iceberg. From a life course perspective, the gendered regional gaps in employment stem from a structural lack of opportunities and a slow adaptation to changing gender roles. Since the 1990s, married women in the North have benefitted from growth in sectors like ICT and fashion. In contrast, those in the South have struggled due to a declining agricultural sector, limited-service opportunities, lower education levels, and persistent social inequalities, which create a negative feedback loop. In this scenario, imbalanced social welfare spending contributes to confining many women in the South to caregiving roles, which further limits their job prospects.
For instance, access to childcare services is a crucial factor for enabling mothers, especially the low educated, to maintain their employment (Del Boca et al. 2009; Saraceno 2003). Even when children reach school age, the limited availability of full-day schooling makes it challenging for mothers to balance work with childcare. Both services are much scarcer in the South compared to the North (ISTAT 2020), making it difficult for mothers to find (and maintain) work. Additionally, care services for older adults are unevenly distributed across the regions (ISTAT 2023, 290). In the North, adequate support allows women to continue working by hiring caregivers, often immigrants. In contrast, in the South, women frequently take caregiving roles themselves, using the available support as a source of income (Bettin et al. 2019). This complex set of challenges puts women at a significant disadvantage contributing to a cycle of low employment rates among women in southern regions.
Investing in a more gender-equal society, particularly in the southern regions, should be a top priority for policymakers. The investments should not focus on merely providing funding or developing passive policies, but rather on implementing measures that enhance employment opportunities for women in these areas and removing barriers which force women to choose between caregiving work and participation in the labor market. The goal should be to support women, particularly those most vulnerable: low-skilled women and mothers. This is a broad category in the southern regions, encompassing a large portion of women who are currently outside the labor market. Consequently, there should be support policies that foster regional entrepreneurship programs for women and initiatives aimed at helping women, especially mothers, to enter/remain/re-enter the workforce; such as investing in childcare support programs. Additionally, vocational training opportunities should be expanded to develop in-demand skills, particularly in emerging sectors. Initiatives to enhance digital literacy and leadership development programs are essential to empower women in the southern regions, providing not only immediate support but also future opportunities. By implementing initiatives to support women, policymakers can help address disparities in working life expectancy, promote greater economic opportunities for women in and for the southern regions, and therefore in the country.
In this work, we focused on a descriptive analysis to highlight the regional heterogeneity in working life expectancy by gender, in Italy. Even if the work describes a complete portrait of the gender and regional differences, the analysis does not focus on important dimensions that are important part of the observed differences. In fact, to better understand our findings, we should consider factors such as socioeconomic status, which unavoidably intersect with both survival and labor force, and vary quite a lot across genders and regions. We chose not to expand our analyses to include additional dimensions, such as education, due to the increased data requirements that would entail, in particular regional life tables by education, which are currently not available.
An additional limitation of this study is related to the characteristics of the data we used to estimate labor force statuses. Indeed, while self-reported information on labor force status is one of the most common measures for estimating working life expectancy and related measures, it may not accurately reflect actual conditions, potentially introducing bias into the estimates and limiting the interpretation of our findings. For example, the number of individuals who report being employed may be overestimated compared to those who are unemployed or retired, due to social desirability biases (Bradburn et al. 1978). Typically, this concern is addressed by referring to supplementary data sources to enhance reliability. In our case, the estimates align with findings from previous studies, leading us to believe that if the measures used do introduce bias, its extent is likely limited.
In conclusion, our findings suggest the need for careful consideration of the duration of working life and its heterogeneity when formulating policies to extend working life. The focus should not solely be on age at retirement, instead, special attention should be given to the employment situations of women and regions in the southern areas of the country.
References
Barbi, E., Casacchia, O., Racioppi, F. (2018). Cause-specific mortality as a sentinel indicator of current socioeconomic conditions in Italy. Demographic Research, 39, 635-646. https://doi.org/10.4054/DemRes.2018.39.21
Barbieri, P., Cutuli, G., Guetto, R., Scherer, S. (2019). Part-time employment as a way to increase women’s employment: (Where) does it work? International Journal of Comparative Sociology, 60(4), 249–268. https://doi.org/10.1177/0020715219849463
Bardasi, E., Gornick, J. C. (2008). Working for less? Women’s part-time wage penalties across countries. Feminist Economics, 14(1), 37-72. https://doi.org/10.1080/13545700701716649
Bettin, G., Giorgetti, I., Staffolani, S. (2019). Who Cares For The Carers? The Impacts Of Immigrant Elderly Care Workers On The Female Labour Supply. Working Papers, 444, Università Politecnica delle Marche (I). https://ideas.repec.org//p/anc/wpaper/444.html
Bianchi, N., Giorcelli, M., & Martino, E. M. (2023). The Effects of Fiscal Decentralisation on Publicly Provided Services and Labour Markets. The Economic Journal, 133(653), 1738-1772. https://doi.org/10.1093/ej/uead022
Bonanomi, A., Rosina, A. (2022). Employment Status and Well-Being: A Longitudinal Study on Young Italian People. Social Indicators Research, 161(2), 581-598. https://doi.org/10.1007/s11205-020-02376-x
Bradburn, N. M., Sudman, S., Blair, E., Stocking, C. (1978). Question Threat and Response Bias. Public Opinion Quarterly, 42(2), 221. https://doi.org/10.1086/268444
Busetta, A., Mendola, D., Vignoli, D. (2019). Persistent joblessness and fertility intentions. Demographic Research, 40, 185-218. https://doi.org/10.4054/DemRes.2019.40.8
Caselli, G., Egidi, V. (1991). A New Insight into Morbidity and Mortality Transition in Italy. Genus, 47(3/4), 1-29.
Del Boca, D., Pasqua, S., Pronzato, C. (2009). Motherhood and market work decisions in institutional context: a European perspective. Oxford Economic Papers, 61(Supplement 1), 147-171. https://doi.org/10.1093/oep/gpn046
Dudel, C., Loichinger, E., Klüsener, S., Sulak, H., Myrskylä, M. (2023). The Extension of Late Working Life in Germany: Trends, Inequalities, and the East–West Divide. Demography, 60(4), 1115-1137. https://doi.org/10.1215/00703370-10850040
Dudel, C., Myrskylä, M. (2017). Working Life Expectancy at Age 50 in the United States and the Impact of the Great Recession. Demography, 54(6), 2101-2123. https://doi.org/10.1007/s13524-017-0619-6
Dudel, C., Myrskylä, M. (2020). Cohort Trends in Working Life Expectancies at Age 50 in the United States: A Register-Based Study Using Social Security Administration Data. The Journals of Gerontology: Series B, 75(7), 1504-1514. https://doi.org/10.1093/geronb/gbaa015
England, P. (2010). The Gender Revolution: Uneven and Stalled. Gender & Society, 24(2), 149-166. https://doi.org/10.1177/0891243210361475
Eurostat (2024a). Duration of Working life. https://ec.europa.eu/eurostat/databrowser/view/lfsi_dwl_a/default/table?lang=en
Eurostat (2024b). Employment – annual statistics. https://ec.europa.eu/eurostat/statistics-explained/index.php?title=Employment_-_annual_statistics
Fasang, A. E., Aisenbrey, S., Schömann, K. (2013). Women’s Retirement Income in Germany and Britain. European Sociological Review, 29(5), 968-980. https://doi.org/10.1093/esr/jcs075
Gruber, J., Wise, D. (2009). Social security programs and retirement around the world: Fiscal implications of reform. Chicago, University of Chicago Press.
Hayward, M. D., Lichter, D. T. (1998). A Life Cycle Model of Labor Force Inequality: Extending Clogg’s Life Table Approach. Sociological Methods & Research, 26(4), 487-510. https://doi.org/10.1177/0049124198026004003
Hochschild, A., Machung, A. (2012). The second shift: Working families and the revolution at home. London, Penguin.
Hoem, J. M. (1977). A Markov chain model of working life tables. Scandinavian Actuarial Journal, 1977(1), 1-20. https://doi.org/10.1080/03461238.1977.10405621
ISTAT. (2020). Offerta di asili nido e servizi integrativi per la prima infanzia. https://www.istat.it/it/archivio/249522
ISTAT. (2023). BES 2023 – Il Benessere Equo e Sostenibile in Italia. https://doi.org/10.1787/e13bef63-en
Loichinger, E., Weber, D. (2016). Trends in Working Life Expectancy in Europe. Journal of Aging and Health, 28(7), 1194-1213. https://doi.org/10.1177/0898264316656509
Lorenti, A., Dudel, C., Myrskylä, M. (2019). The Legacy of the Great Recession in Italy: A Wider Geographical, Gender, and Generational Gap in Working Life Expectancy. Social Indicators Research, 142(1), 283-303. https://doi.org/10.1007/s11205-018-1910-7
Lozano, M., Rentería, E. (2019). Work in Transition: Labour Market Life Expectancy and Years Spent in Precarious Employment in Spain 1986-2016. Social Indicators Research, 145(1), 185-200. https://doi.org/10.1007/s11205-019-02091-2
Lynch, M., Bucknall, M., Jagger, C., Wilkie, R. (2022). Projections of healthy working life expectancy in England to the year 2035. Nature Aging, 2(1), 13-18. https://doi.org/10.1038/s43587-021-00161-0
Marino, F., Nunziata, L. (2017). The labor market in Italy, 2000-2016. IZA World of Labor. https://doi.org10.15185/izawol.407
Moretti, M., Strozza, C. (2022). Gender and educational inequalities in disability-free life expectancy among older adults living in Italian regions. Demographic Research, 47, 919-934. https://doi.org/10.4054/DemRes.2022.47.29
Mussida, C., Picchio, M. (2014). The trend over time of the gender wage gap in Italy. Empirical Economics, 46(3), 1081-1110. https://doi.org/10.1007/s00181-013-0710-9
OECD (2019a). OECD Employment Outlook 2019: The Future of Work. https://doi.org/10.1787/9ee00155-en
OECD (2019b). Strengthening Active Labour Market Policies in Italy. https://doi.org/10.1787/160a3c28-en
OECD (2019c). OECD Economic Surveys: Italy 2019. https://doi.org/10.1787/369ec0f2-en
OECD (2022). OECD Employment Outlook 2022: Building Back More Inclusive Labour Markets. https://doi.org/10.1787/1bb305a6-en
OECD (2023). Pensions at a Glance 2023: OECD and G20 Indicators. https://doi.org/10.1787/678055dd-en
O’Higgins, N. (2011). Italy: Limited policy responses and industrial relations in flux, leading to aggravated inequalities. Work inequalities in the crisis: Evidence from Europe, 314-49.
Saraceno, C. (2003). La conciliazione di responsabilità familiari e attività lavorative in Italia: paradossi ed equilibri imperfetti. Polis, 17(2), 199-228.
Solovieva, S., De Wind, A., Undem, K., Dudel, C., Mehlum, I. S., Van Den Heuvel, S. G., et al. (2024). Socioeconomic differences in working life expectancy: a scoping review. BMC Public Health, 24(1), 735. https://doi.org/10.1186/s12889-024-18229-y
Sullivan, D. F. (1971). A single index of mortality and morbidity. HSMHA health reports, 86(4), 347.
Tetzlaff, J., Luy, M., Epping, J., Geyer, S., Beller, J., Stahmeyer, J. T., et al. (2022). Estimating trends in working life expectancy based on health insurance data from Germany – Challenges and advantages. SSM – Population Health, 19, 101215. https://doi.org/10.1016/j.ssmph.2022.101215
Töpfer, M. (2020). The Age Pay Gap and Labour Market Heterogeneity: A New Empirical Approach Using Data for Italy. LABOUR, 34(1), 1-25. https://doi.org/10.1111/labr.12161
Vignoli, D., Tocchioni, V., Salvini, S. (2016). Uncertain lives: Insights into the role of job precariousness in union formation in Italy. Demographic Research, 35, 253-282. https://doi.org/10.4054/DemRes.2016.35.10
Wilkinson, R. G., Marmot, M. G., & Weltgesundheitsorganisation (eds., 2003). Social determinants of health: the solid facts (2nd. ed.). Copenhagen, WHO Regional Office for Europe.
Wilmoth, J. R. (2000). Demography of longevity: past, present, and future trends. Experimental Gerontology, 35(9), 1111–1129. https://doi.org/10.1016/S0531-5565(00)00194-7
1 Labor force status (employed, unemployed, inactive, or retired) is self-reported at the interview.
2 https://www.bancaditalia.it/statistiche/tematiche/indagini-famiglie-imprese/bilanci-famiglie/distribuzione-microdati/index.html?com.dotmarketing.htmlpage.language=1
3 Joblessness category includes unemployed and inactive individuals. Therefore, inactive women, including housewives are classified in the joblessness category. The distinction between each labor force state by age is a crucial characteristic of SHIW that other official data sources, such as the much larger Labor Force Survey, do not allow.
4 We download official life tables from Istat, at https://demo.istat.it/app/?i=TVM&l=it
5 Complete tables with Working, Retirement and Inactive Life Expectancy are available in the appendix.