https://doi.org/10.36253/bsgi-7621
Mapping Local Climate Zones and Exploring Temperature Dynamics in the Metropolitan Area of Florence
Mappatura delle zone climatiche locali ed esplorazione delle dinamiche termiche nell’area metropolitana di Firenze
Dipartimento di Scienze e Tecnologie Agrarie, Alimentari, Ambientali e Forestali, Università di Firenze, Italy
E-mail: mattia.niccoli@unifi.it; costanza.borghi@unifi.it; gherardo.chirici@unifi.it
Abstract. This paper investigates the temperature dynamics within the Metropolitan Area of Florence, and particularly in the “Piana Fiorentina”. It focuses on the Urban Heat Island (UHI) effect by utilising Local Climate Zones (LCZs), Land Surface Temperature (LST), and crowdsourced air temperature data. The study aims to map LCZs and explore temperature variations across urban and peri-urban landscapes. A supervised classification combining remote sensing data from Sentinel-2 and geospatial urban morphology parameters was employed to generate an LCZ map of the Florence-Prato-Pistoia area. LST data were used to analyse temperature differences across LCZs, highlighting seasonal and spatial variations. Additionally, the study incorporated air temperature measurements from Citizen Weather Stations (CWS) to assess intra-urban temperature dynamics, representing the first use of such data in this context. The results revealed significant thermal contrasts between urban and natural LCZs, demonstrating the UHI effect, its seasonal variability, and the diurnal-to-nocturnal cycle. This work contributes to the understanding of urban climate behaviour in and around Florence and highlights the usefulness of LCZs mapping and CWS data for urban climate studies.
Keywords: local climate zones, urban heat island, land surface temperature, citizen weather stations.
Riassunto. Questo articolo indaga le dinamiche termiche all’interno dell’area metropolitana di Firenze, e in particolare nella Piana Fiorentina. Il lavoro si concentra sull’effetto dell’isola di calore urbana (UHI) utilizzando le Zone Climatiche Locali (LCZ), la temperatura della superficie terrestre (LST) e i dati di temperatura dell’aria raccolti in crowdsourcing. Lo studio mira a mappare le LCZ e a esplorare le variazioni di temperatura nei diversi paesaggi urbani e periurbani. Una classificazione supervisionata che combina i dati di telerilevamento da Sentinel-2 e i parametri geospaziali della morfologia urbana è stata utilizzata per generare una mappa LCZ dell’area Firenze-Prato-Pistoia. I dati LST sono stati utilizzati per analizzare le differenze di temperatura tra le LCZ, evidenziando le variazioni stagionali e spaziali. Inoltre, lo studio ha incorporato misure di temperatura dell’aria provenienti da stazioni meteorologiche cittadine (CWS) per valutare le dinamiche di temperatura intra-urbane, rappresentando il primo utilizzo di tali dati in questo contesto. I risultati hanno rivelato significativi contrasti termici tra le LCZ urbane e quelle naturali, dimostrando l’effetto UHI, la sua variabilità stagionale e il ciclo diurno-notturno. Questo lavoro contribuisce alla comprensione del comportamento del clima urbano a Firenze e dintorni ed evidenzia l’utilità della mappatura delle LCZ e dei dati CWS per gli studi sul clima urbano.
Parole chiave: zone climatiche locali, isola urbana di calore, temperatura della superficie terrestre, stazioni meteo cittadine.
Contents
3.1. Local Climate Zones Mapping Workflow
3.2. Land Surface Temperature Analysis Workflow
3.3. Air Temperature Analysis Workflow
4.2. Land Surface Temperature and LCZs
1. Introduction
As global warming became a major concern related to climate change, it gained the attention of the scientific community, especially in urban areas. Indeed, cities are not only the main contributors to climate change, producing over 70% of global CO2 emissions (Gurney et al. 2015), but also among the areas of the world most impacted by rising temperatures (Creutzig et al. 2016). This, combined with rapid urbanisation, has intensified the Urban Heat Island (UHI) effect (Chapman et al. 2019). The term was first introduced in the 1940s (Balchin, Pye 1947) and refers to significantly higher urban temperatures in cities compared to peri-urban and natural areas, due to alterations in surface energy and radiation balance. This phenomenon creates significant challenges for public health, infrastructure, and overall urban liveability (Oke et al. 2017).
To better study urban climate and the UHI effect, the concept of Local Climate Zones (LCZs) was introduced by Stewart and Oke (2012). Recently, the existing body of literature on LCZs has been growing rapidly (Huang et al. 2023), providing a standardised classification for examining urban temperature patterns (Kotharkar et al. 2022), microclimate dynamics (Verdonck et al. 2018), and UHI effects (Voogt, Oke 2003). In Italy, the LCZ framework has received relatively little attention, with roughly 4-6 articles published so far (Vasić et al. 2025).
LCZ classification categorises urban and peri-urban areas into 17 standardised classes based on their structural and land-cover characteristics. Unlike the traditional urban-rural dichotomy, LCZs identify 10 “built-up” and 7 “land-cover” classes used to classify the urban landscape. LCZs are thus defined as “regions of uniform surface cover, structure, material, and human activity that span hundreds of metres to several kilometres in horizontal scale” and are characterised by “a characteristic screen-height temperature regime that is most apparent over dry surfaces, on calm, clear nights, and in areas of simple relief” (Stewart, Oke 2012).
Land Surface Temperature (LST) data, derived from satellite-based thermal sensors, are commonly used to study temperature patterns in urban climates. LST data offer several advantages: they provide continuous spatial coverage, medium spatial resolution, and are easily accessible from satellite missions, making them useful for identifying UHI effects by comparing urban to rural areas.
Several studies combine LCZ classification and LST data to explore temperature dynamics in many cities of the world (Cai et al. 2018; Geletič et al. 2016; Unal Cilek, Cilek 2021). In Italy, this kind of application has been developed for the city of Milan by Puche et al. (2023), who studied the thermal behaviour of LCZs in the summer months, providing some interesting results about UHI effects.
LST has also been extensively investigated in the area of Florence (Morabito et al. 2021; Guerri et al. 2021), but, to the best of our knowledge, never in combination with LCZ classification.
Nevertheless, satellite-based LST presents some drawbacks due to limited cloud-free acquisition frequency. Moreover, it primarily represents surface temperatures rather than near-surface air temperatures, which are more closely associated with human thermal comfort and health (Good 2016; Ho et al. 2016). To overcome this issue, ground-based air temperature observations are pivotal. Nevertheless, the lack of sufficient in situ measurements often hinders this approach, since official public weather stations are generally too scarce and poorly distributed to be exploited for UHI-related studies. One solution is to use data from Citizen Weather Stations (CWS) (Bell et al. 2015). These networks of low-cost, commercial stations, operated by private citizens for domestic use, are often much denser and more spatially distributed in urban areas than official sensors, allowing the collection of sufficiently granular data to conduct air temperature analysis.
Crowdsourced air temperature measurements acquired by CWS can thus be used in combination with LCZs (Puche et al. 2023). Advanced applications of CWS data have been demonstrated for urban microclimate modelling in several cities such as Oslo (Venter et al. 2020), Zurich (Zumwald et al. 2021), Warsaw (Hassani et al. 2023), and Vienna (Feichtinger et al. 2020).
As UHI intensifies and cities become hotspots for extreme heat events (Creutzig et al. 2016), municipalities must deploy mitigation strategies based on Nature-Based Solutions (NBS) (United Nations Global Compact 2019). In our study area, local governments are moving in this direction. For example, Prato has adopted the “Strategie per la Forestazione” to expand tree cover and connect a network of green spaces. Florence, instead, has recently approved the “Piano del Verde e degli Spazi Aperti,” an ambitious package of coordinated measures guided by the 3-30-300 principles: 3 trees visible from every window, 30% green coverage, and a maximum of 300 metres between the house and the nearest green space (Konijnendijk 2023).
Despite the urgency of such interventions being well acknowledged, it is not always clear where and how it is better to act. As shown, quantifying the intensity of the UHI and detecting its spatial and temporal variability is not straightforward, and such complexity can impede or misdirect policy design. In this regard, microclimate 3D simulations have been extensively used for testing fine-scale mitigation scenarios in Florence, but their applicability is typically limited to small areas, making it difficult to derive guidance for municipality-scale policy. For example, Romano et al. (2020) and Romano et al. (2022) applied ENVI-met software (ENVI-met) to perform micro-simulations in two squares of Florence, “Piazza Togliatti” and “Largo Annigoni”, respectively. Banti et al. (2025), instead, extended the approach to a residential district covering approximately 6 ha. Similarly, Guerri et al. (2023) evaluated three different tree-designed strategies to mitigate UHI in a commercial area of about 25 ha, the agri-food market in Florence’s northern periphery.
As an alternative to site-specific urban microclimate modelling, Guerri et al. (2021) identified significant summertime hotspots across the entire Metropolitan Area of Florence using wall-to-wall LST mapping and statistical analysis. However, while their study covers the entire “Piana Fiorentina”, its results are less generalisable ― and omit air temperature statistics ― because they are not anchored to a standardised classification of the urban fabric. By contrast, coupling a wall-to-wall LCZ map with quantitative thermal data of both LST and air temperature, our study aims to offer local authorities a clear picture of municipal urban-climate dynamics, helping them target sensitive areas for intervention, allocate resources more efficiently, and avoid leaving vulnerable zones unaddressed.
In summary, this study examines thermal behaviour in Florence’s metropolitan area, with a special focus on the “Piana Fiorentina” region. It investigates the UHI phenomenon by mapping LCZs, analysing LST data, and incorporating crowdsourced air temperature measurements to explore temperature differences across urban and surrounding peri-urban environments. The aim of the study is threefold: (i) mapping LCZs for the entire Metropolitan Area of Florence-Prato-Pistoia, (ii) analysing LST across LCZs, and (iii) exploring air temperature differences using crowdsourced data from CWS.
2. Study Area
The analysis focuses on an Area of Interest (AOI) coincident with the Metropolitan Area of Florence, in Tuscany, Central Italy (Fig. 1), an urbanised region that spans 1,084.9 km² and includes 19 municipalities across the administrative units of Florence, Prato, and Pistoia.
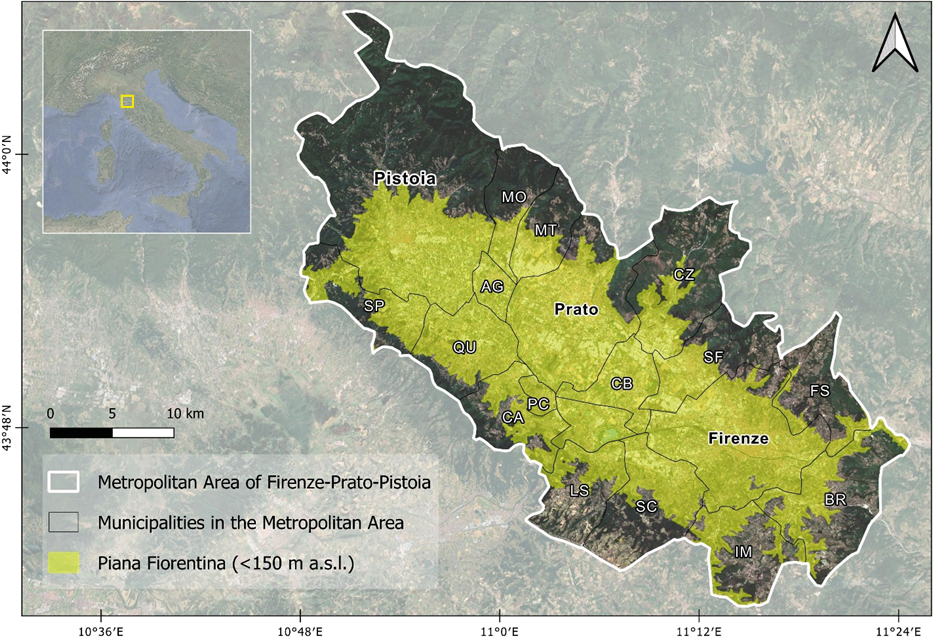
As defined here, the AOI ranges from 26 m to 1602 m a.s.l. However, to avoid elevation being a factor in temperature analysis, we propose focusing on the “Piana Fiorentina”, identified as a flat area of 538 km² with a maximum elevation of 150 metres. This region is not an official administrative unit, but it is commonly acknowledged in the socio-cultural context of its inhabitants.
With a population of around 1 million people (Istat 2024), the “Piana Fiorentina” is highly anthropised and characterised by a concentration of residential, commercial and industrial zones and transport infrastructures. This intense urbanisation causes territorial fragmentation of its natural and vegetated areas, which are instead distributed on the surrounding hills. This mixed landscape of natural and urban zones makes it an ideal location for investigating local climate phenomena, particularly the Urban Heat Island effect.
According to the climate classification developed by Rubel and Kottek (2010), the study area is characterised by a blend of Mediterranean (Csa) and humid subtropical (Cfa) types, with mild winters and hot, dry summers. Due to its morphological characteristics, within an intermontane basin of alluvial origin in the hinterland of northern Tuscany, the “Piana Fiorentina” tends to record among the highest summer temperatures in Italy (Consorzio LaMMA).
Within this context, global warming is exacerbating this trend. According to the data provided by Consorzio LaMMA, several indicators confirm this change. The mean annual temperature of Florence from 1991 onwards is around 15 °C, but it increases slightly by a few decimal degrees each year. The warming is more evident during the summer months. The summer of 2022 recorded anomalies of +2.3 °C, +1.2 °C, +3.3 °C for the mean, minimum, and maximum temperature, respectively, compared to the 1981-2010 climate baseline. Nine of the ten hottest summers occurred in the last 20 years, with an average of 25 °C, and 40 days exceeding 35 °C in 2022. Heat waves have quadrupled in 50 years, and tropical nights (>20 °C) have doubled since 1961-1991, surpassing 20 in summer 2023.
These trends underscore the need for studies on local climate dynamics and the impact of urban morphology on temperature variations, which this research aims to address in the Florence-Prato-Pistoia metropolitan area.
3. Methodology
3.1. Local Climate Zones Mapping Workflow
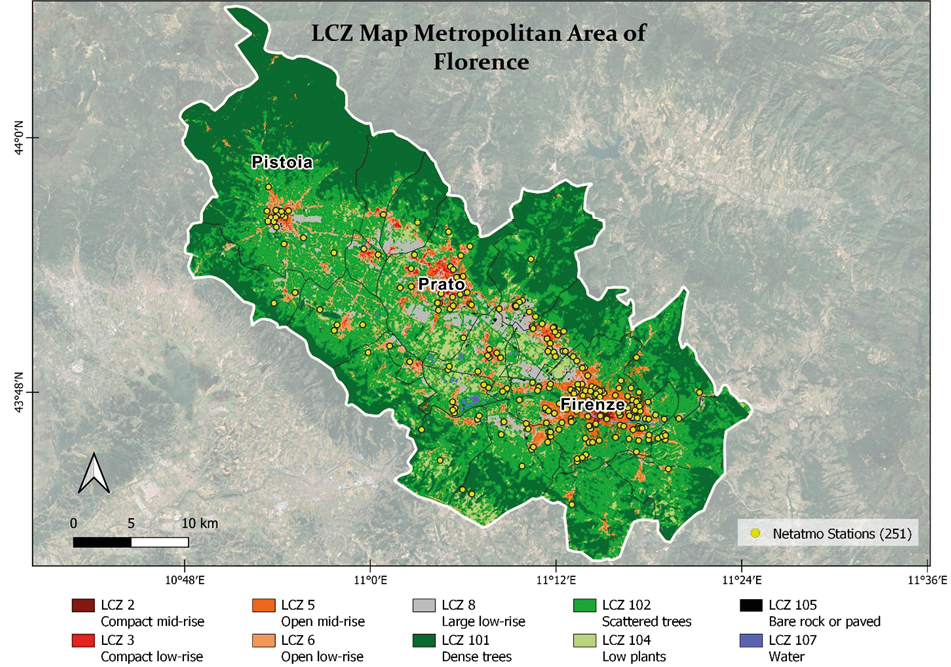
In the first part of this study, a raster LCZ map was created for the study area with a resolution of 20 metres. Figure 2 schematises the workflow. The map was created using the Random Forest (RF) algorithm (Breiman 2001), trained on the basis of manual photo-interpretation carried out following the World Urban Database and Access Portal Tools (WUDAPT) protocol (Demuzere et al. 2021). Two independent sets of 100 polygons each were drawn, one used for model training and the other for accuracy evaluation (Fig. 3).
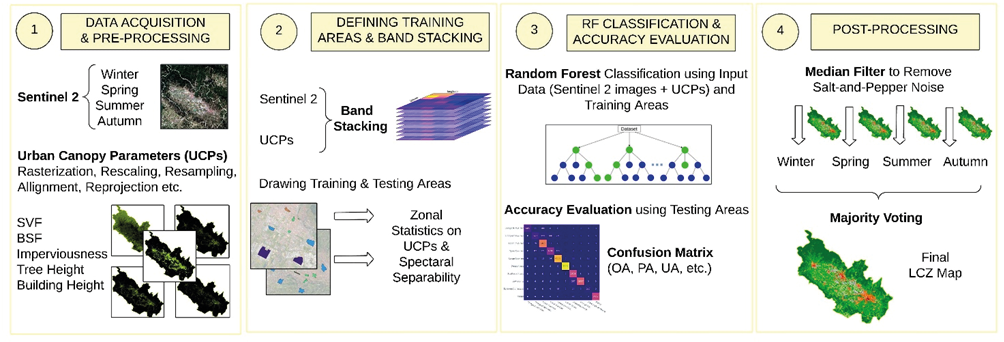
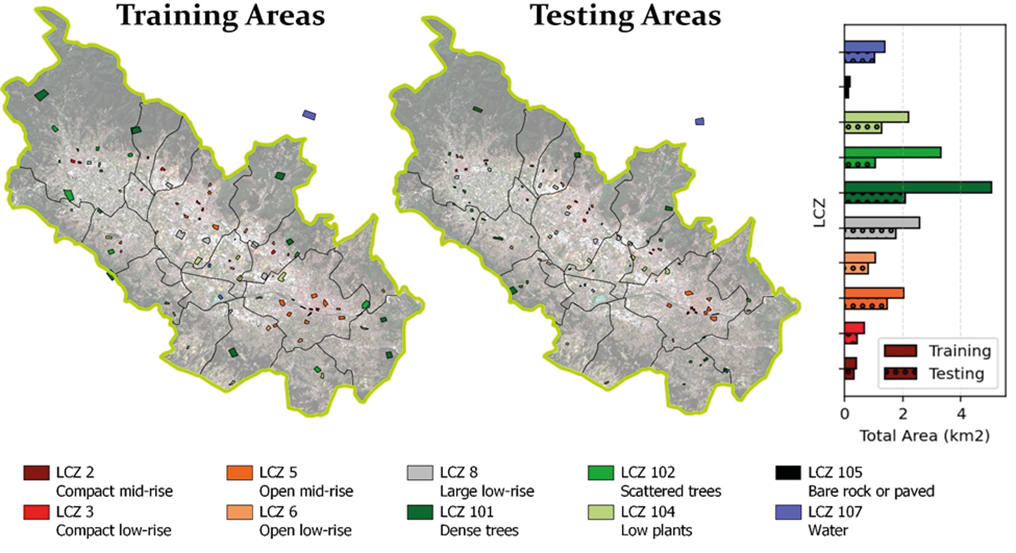
We decided to map only the most important and representative classes in the AOI: LCZ 2 (Compact Mid-Rise), LCZ 3 (Compact Low-Rise), LCZ 5 (Open Mid-Rise), LCZ 6 (Open Low-Rise), LCZ 8 (Large Low-Rise), LCZ 105 (Black Rock or Paved) for urban classes; and LCZ 101 (Dense Trees), LCZ 102 (Scattered Trees), LCZ 104 (Low Plants), LCZ 107 (Water) for natural classes.
RF is a non-parametric algorithm that enables supervised classification at pixel level, and it is the most widely used in the field of LCZ mapping (Aslam, Rana 2022). The model’s parameters were fine-tuned through an iterative procedure, as implemented in the code of Oxoli et al. (2023). A combined remote-sensing (RS) and GIS-based method was chosen for the LCZ mapping (Huang et al. 2023), since it has been shown to produce better LCZ maps in terms of accuracy (Puche et al. 2023; Vavassori et al. 2024).
Thus, the predictors for the RF classification are derived from Sentinel-2 images and from ancillary geospatial information, as adopted within the Local Climate Zones & Open Data Cube (LCZ-ODC) project (Oxoli et al. 2023; Vavassori et al. 2023).
In detail, geometrically and atmospherically corrected Level 2A cloud-free Sentinel-2 images were sourced from the Copernicus Programme (Copernicus Browser). We used only the 9 bands (band 2, 3, 4, 5, 6, 8, 8a, 11, and 12) at 20-metre spatial resolution, since this is a good compromise between the level of details required to capture discontinuities in the urban and peri-urban landscape and the extent of the AOI.
We collected a total of five cloud-free images covering the study area in different seasons on the following dates: 30 October 2022, 18 April 2022, 17 July 2023, 26 August 2023, 18 December 2023.
Ancillary geospatial information includes Building Height, derived from “Carta Tecnica Regionale” (CTR) (GEOscopio - Regione Toscana), from which two other layers have been derived through GIS operations, namely the Sky View Factor (SVF) and the Building Surface Fraction (BSF); Imperviousness, obtained from Imperviousness Density 2018 dataset produced by the Copernicus Land Monitoring Services (CLMS Portfolio); and Tree Height, derived from ETH Global Sentinel-2 10 metres Canopy Height (Lang et al. 2023).
As a result, we obtained five different data cubes for the five different dates; each data cube consists of 9 Sentinel-2 bands and 5 ancillary datasets, for a total of 14 predictors used to create five different LCZ maps with RF classification.
The five LCZ maps were first filtered with a high-pass filter to reduce the salt-and-pepper noise and then aggregated into the final LCZ map with a modal operator.
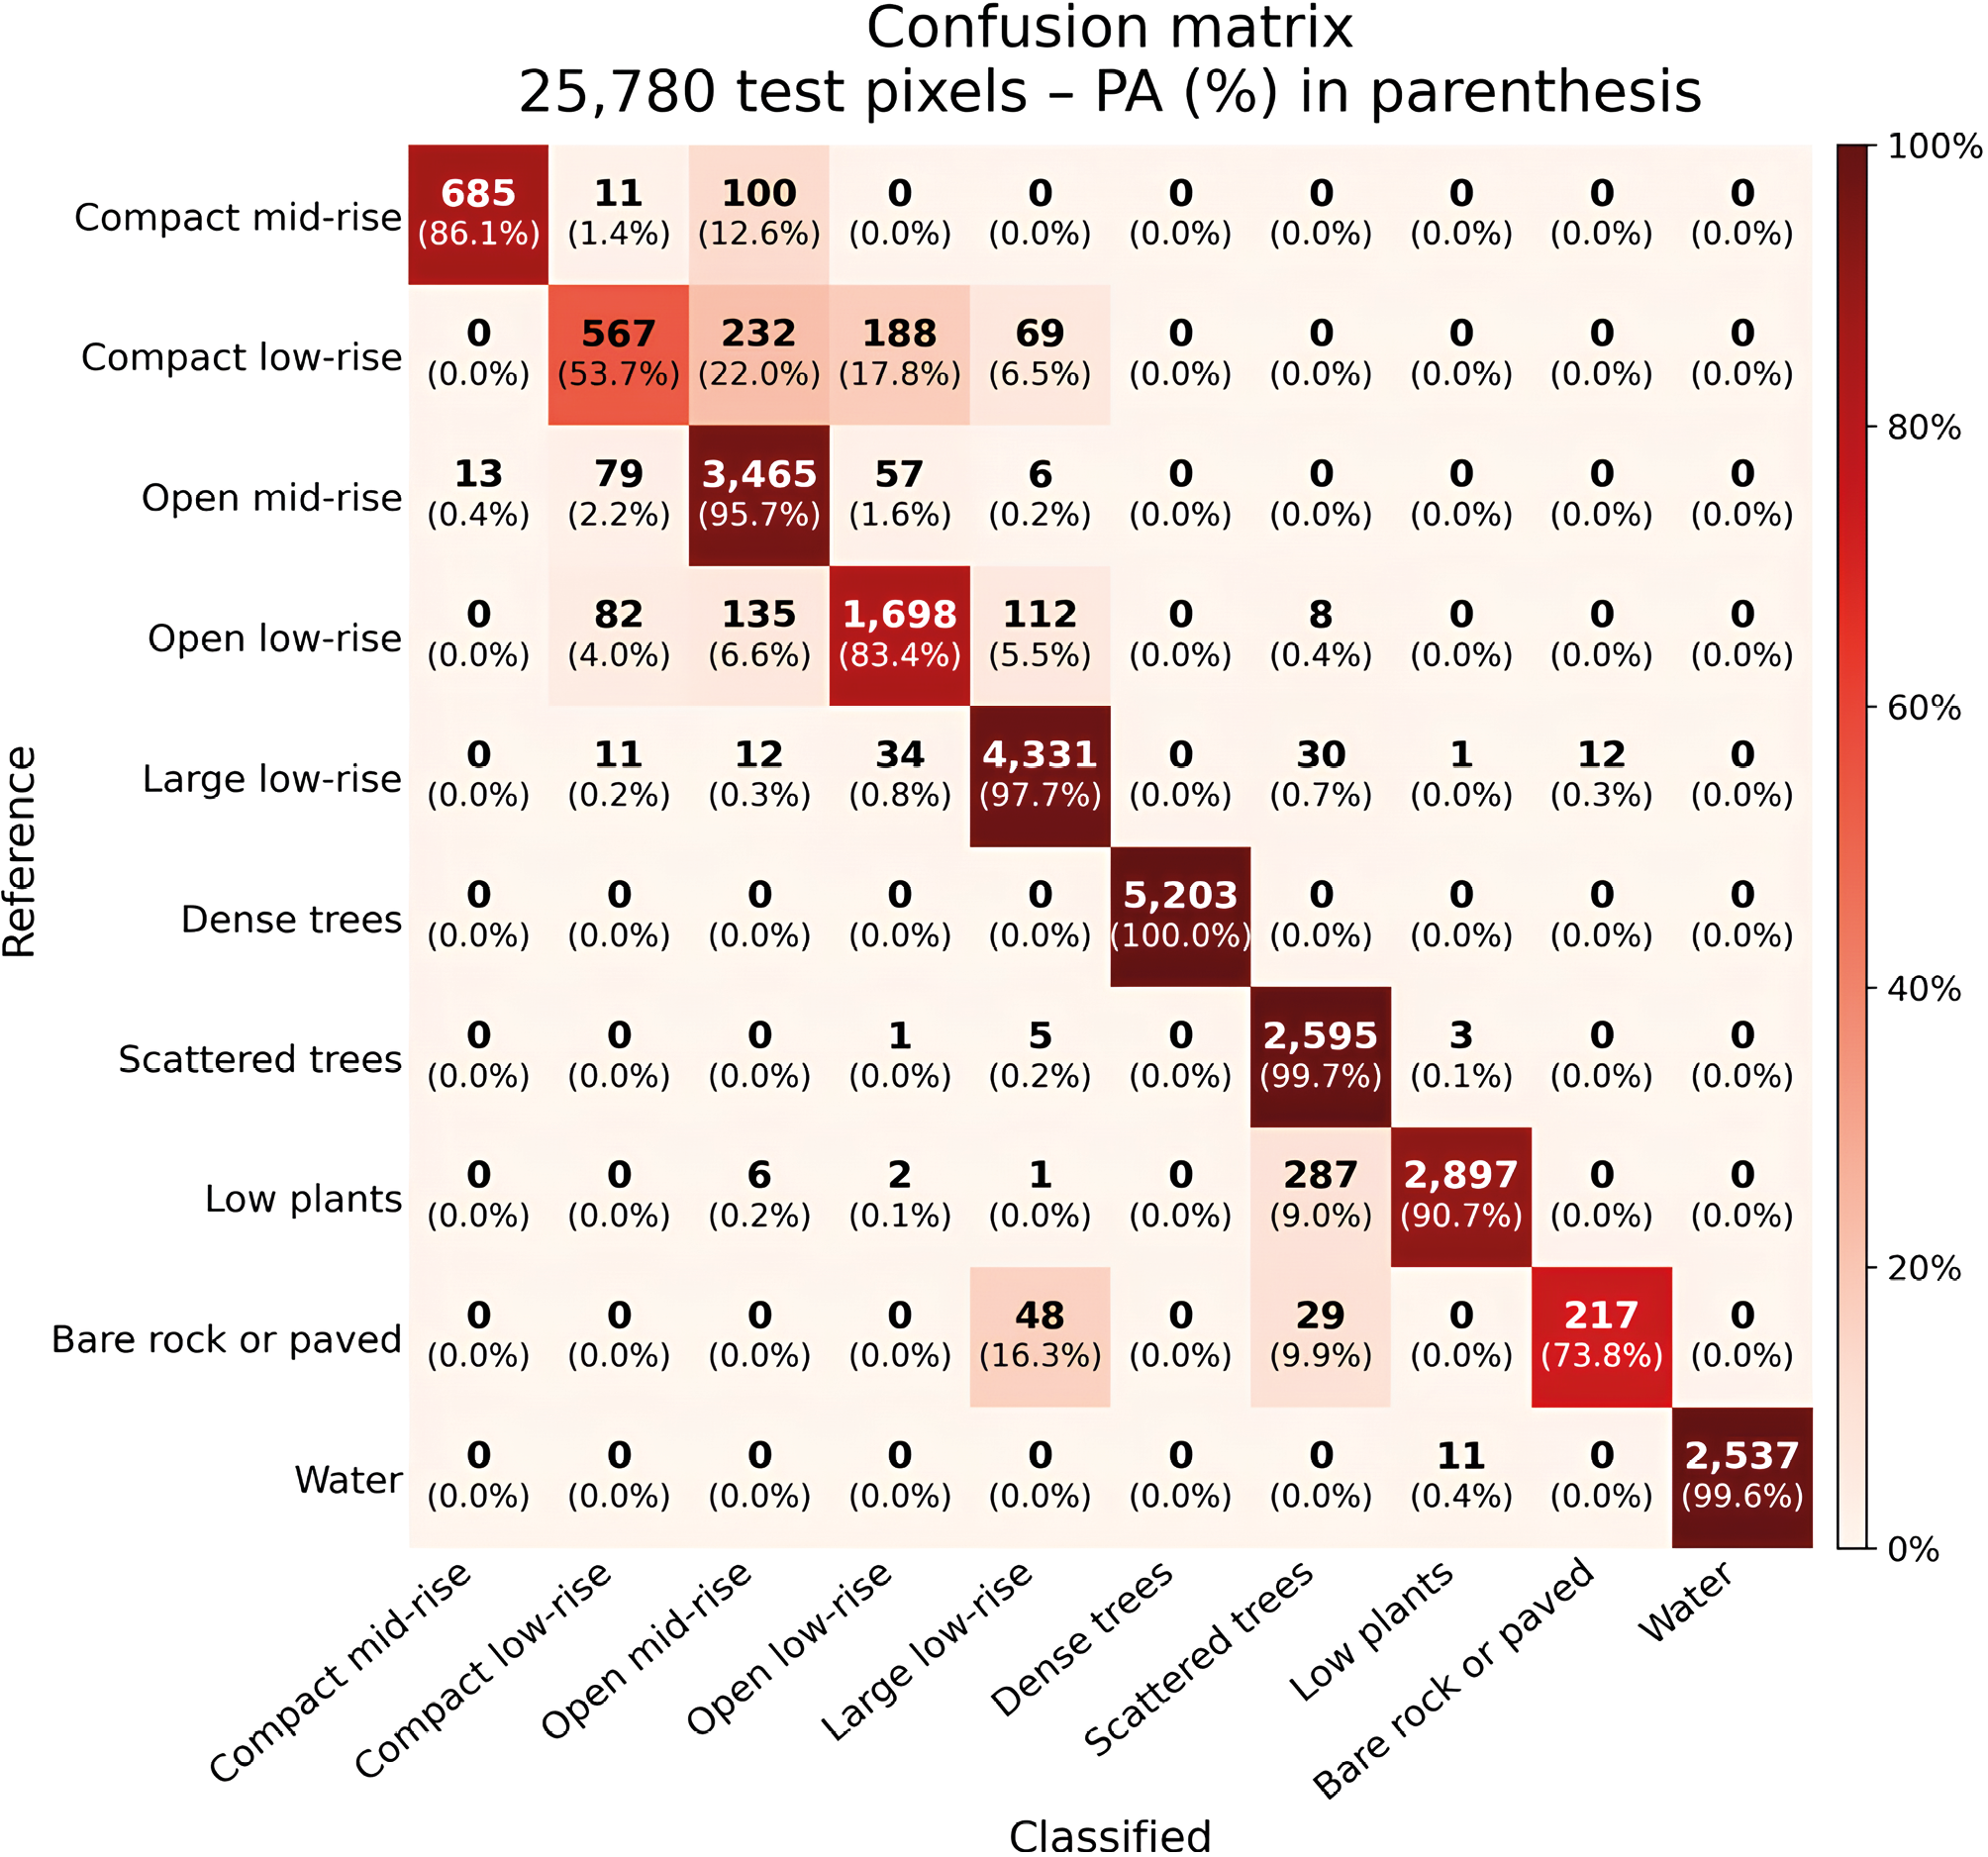
Accuracy evaluation of LCZ maps was performed using an independent set of testing areas, not seen by the model. Confusion matrices were derived, yielding several accuracy measures, including (i) Overall Accuracy (OA); (ii) Producer’s Accuracy (PA); (iii) User’s Accuracy (UA). OA provides a general evaluation of the maps, whereas PA and UA give a class-by-class assessment.
3.2. Land Surface Temperature Analysis Workflow
The second part of the study focused on analysing LST within the different LCZ classes mapped in the previous step. Figure 4 summarises the workflow. LST data were obtained from Landsat 8 at 30 m spatial resolution. Ready-to-use Collection 2 Level 2 (C2L2) products were accessed through a script in Google Earth Engine, which allowed easy retrieval of multiple images for each season in the years 2022 and 2023 (an average of 15 images per season). A cloud-mask filter exploiting the QA_PIXEL band was also applied. After data cleaning, seasonal images were averaged to produce a single LST map for each season, ensuring consistency and minimising anomalies caused by temporary weather conditions. Raw data from Landsat 8 cannot be directly interpreted as LST values, but a linear transformation, such as the one adopted by Puche et al. (2023), was applied.
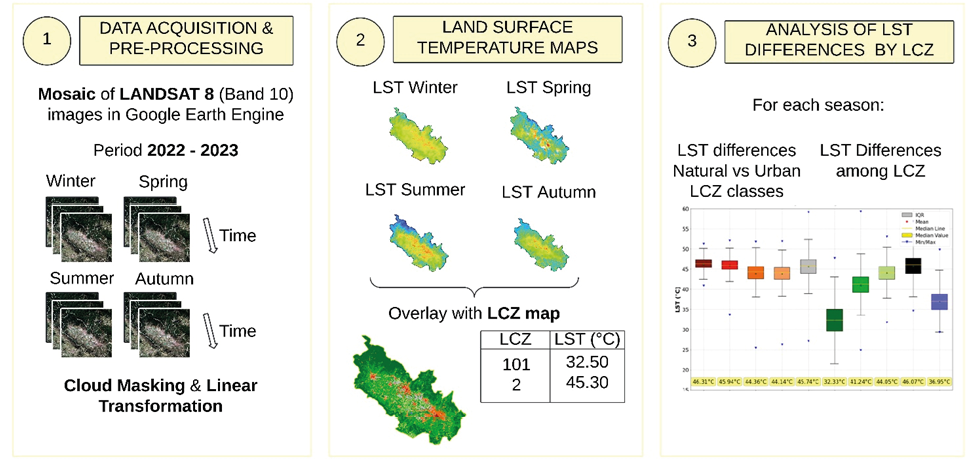
After these operations of image acquisition, cloud masking, and mosaicking, the four seasonal LST maps were considered for the temperature analysis. The final LCZ map was used as a reference, and the thermal behaviour of different LCZ classes was investigated.
Seasonal LST patterns across urban and natural LCZs were examined to explore variations in surface temperature and how they contribute to the UHI effect. The results were summarised by box plots.
3.3. Air Temperature Analysis Workflow
In the third part of the study, we examined air temperature variations across LCZs using data from CWS from the Netatmo network (https://weathermap.netatmo.com/) of weather stations. Netatmo is a French company that produces commercial, low-cost sensors for domestic use to monitor outdoor and indoor climate conditions. To provide a more precise description of the Netatmo network and Netatmo devices, readers can refer to Meier et al. (2017) and Napoly et al. (2018). Clients can decide to share their sensors’ data, which can be queried through a dedicated Application Programming Interface (API). Figure 5 shows the adopted procedure.
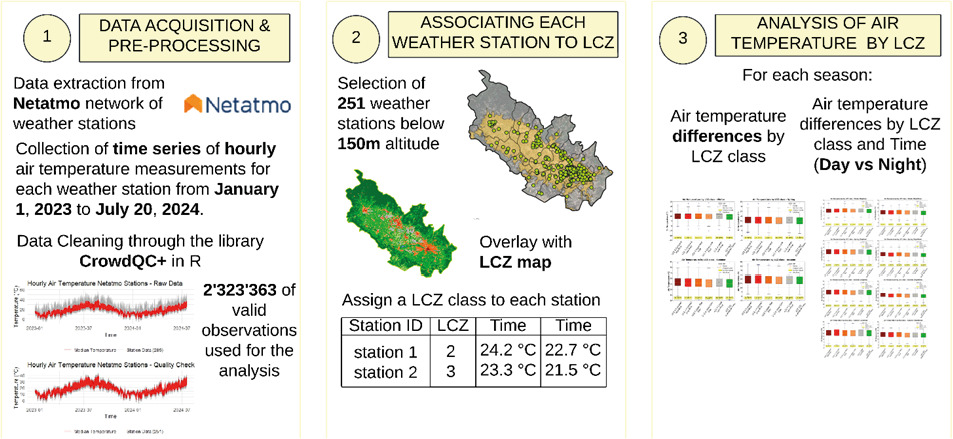
We retrieved the hourly air temperature measurements from January 2023 to July 2024 across all available stations within the AOI through a Python script that uses the dedicated lnetatmo library and the two API endpoints getpublicdata and getmeasure.
Due to potential inaccuracies in crowdsourced weather data caused by exposure to sunlight, placement near warm surfaces, or sensor malfunctions, a Quality Control (QC) process was carried out. The poor quality of CWS data is well recognised in literature (Bell et al. 2015; Muller et al. 2015), and we carried out the data-cleaning procedure proposed by Fenner et al. (2021), fully implemented by the open-source CrowdQC+ package in R. The method consists of a series of statistically based steps applied sequentially which aim to remove erroneous data, either single observations or entire station time series, and improve overall accuracy.
The main idea of CrowdQC+ is that there is trustworthy information in a large number of individual measurements, which can be used to check individual values, relying on stations’ metadata and statistical distribution to detect temporal and spatial outliers. For more details, the reader may refer to Fenner et al. (2021). In this case, data cleaning up to the fifth level was adopted, reducing the number of observations by 30%.
At the end of the QC procedure, we were able to use a total of 2.3 million valid air temperature observations from 251 Netatmo stations. The dominant LCZ class was assigned to each station using a 150-metre-diameter circular buffer area. This allowed the study of both seasonal and diurnal-nocturnal air temperature patterns between LCZs. For this purpose, we calculated the LCZ differences in mean air temperature, both during daytime and night-time. In addition, Cohen’s d (Cohen 1977) was calculated, as suggested in Puche et al. (2023), to give a standardised measure of effect size that accounts for each LCZ’s internal variability.
An in-depth analysis was conducted to monitor the differences in tropical-night occurrence between LCZs. To facilitate a more comprehensive understanding of the methodology employed in this analysis, an illustrative example is presented below, based on actual data. For instance, we observed that LCZ 5 accounts for 56.3% of tropical nights. This value is obtained by considering each of the 135 stations included in this group. The period under consideration is the summer months between 1 June 2023, and 31 August 2023, as well as the period from 1 June to 20 July 2024. Therefore, 141 days and nights are considered for the specified period. The total number of nights (19,035) is obtained by multiplying the actual number of nights (141) by number of stations (135). For each station, the number of nights with a minimum temperature greater than 20 °C is calculated and then aggregated with the values from all stations in LCZ 5. The resulting sum (10,726) is then used to calculate the ratio of tropical nights to the total number of nights for class LCZ 5 (56.3%).
4. Results
4.1. Local Climate Zones
Figure 6 shows the final LCZ map at 20-metre spatial resolution, obtained after the application of the median filter and majority voting.
The geographical distribution of LCZs was also analysed at municipal level, as represented in Figure 7(a). From this bar chart, Florence emerges as the most urbanised area, where almost half (45%) of its territory is occupied by urban LCZs. Intensely built-up municipalities also include Agliana (34%), Campi Bisenzio (32%), Prato (33%), and Poggio a Caiano (33%). Focusing on vegetated areas, LCZ 101 (Dense Trees) is almost absent or hardly present in those municipalities completely located in the “Piana Fiorentina”, such as Agliana (0.7%), Campi Bisenzio (0.9%), Signa (6.5%), and Florence (8.9%). LCZ 102 (Scattered Trees) is relatively evenly distributed across all municipalities.
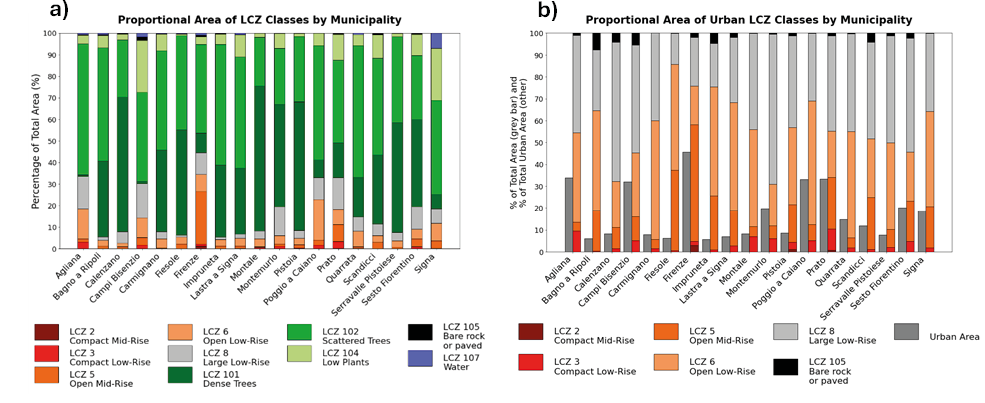
Figure 7(b) helps break down the composition of each municipality’s urban landscape. The dark grey bars indicate the percentage of urban LCZs relative to the total municipal area, while the coloured bars break down the grey bars, expressing the percentage of each urban LCZ class over the built-up area. Florence displays a distinctive profile dominated by taller (>15 metres) residential buildings (LCZ 5), which account for 53% of the total urban area, unlike its neighbouring municipalities, which have more extensive open, low-rise residential areas (LCZ 6). The Compact Mid-Rise class (LCZ 2) represents only a small fraction of the urban fabric and is found in the historic city centres in Florence, Prato, and Pistoia. LCZ 8 (Large Low-Rise), representing industrial zones, is prominent in many municipalities. It is generally the most widespread urban class, accounting for more than 40%, with few exceptions. In Montemurlo and Calenzano, in particular, LCZ 8 accounts for 68% and 64%.
The results of the accuracy evaluation of the final LCZ map are reported in Table 1 and in the confusion matrix of Figure 8. The OA is 93.85%. Notably, natural LCZ classes such as Dense Trees (LCZ 101) and Water (LCZ 107) were classified with near-perfect accuracy due to their distinct spectral signatures in the Sentinel-2 imagery. For urban LCZ classes, the PA and UA were lower but still satisfactory.
| LCZ | Support (n. of pixels) | PA | UA | OA | |
|---|---|---|---|---|---|
| LCZ 2 | Compact Mid-Rise | 796 | 86.05% | 98.13% | 93.85% |
| LCZ 3 | Compact Low-Rise | 1056 | 53.69% | 75.60% | |
| LCZ 5 | Open Mid-Rise | 3620 | 95.72% | 87.72% | |
| LCZ 6 | Open Low-Rise | 2035 | 83.44% | 85.76% | |
| LCZ 8 | Large Low-Rise | 4431 | 97.74% | 94.73% | |
| LCZ 101 | Dense trees | 5203 | 100.00% | 100.00% | |
| LCZ 102 | Scattered trees | 2604 | 99.65% | 87.67% | |
| LCZ 104 | Low plants | 3193 | 90.73% | 99.86% | |
| LCZ 105 | Bare rock or paved | 294 | 73.81% | 94.76% | |
| LCZ 107 | Water | 2548 | 99.57% | 100.00% |
4.2. Land Surface Temperature and LCZs
The analysis was carried out for each season separately, using the seasonal LST maps constructed as described in Section 3. Different LST patterns were found according to LCZs and season (Fig. 9). Only limited LST difference were observed in winter. Urban LCZ classes (LCZ 2: 13.65 °C, LCZ 3: 12.74 °C) tend to be warmer than natural classes (LCZ 107: 9.75 °C, LCZ 101: 10.48 °C).
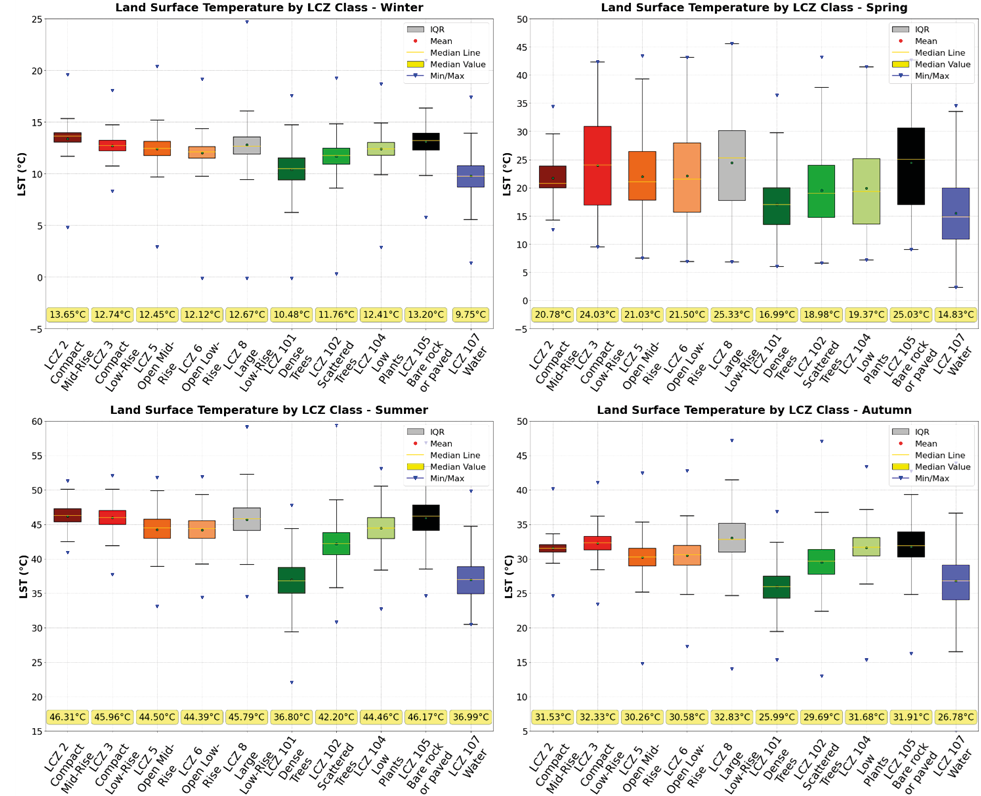
In spring and autumn, LCZs appear to exhibit distinct climatic behaviours. The spring box plot, with thick boxes and long whiskers, indicates considerable variability. The warmest class is Large Low-Rise (LCZ 8), with a median LST of 25.33 °C, approximately 4 °C higher than other urban classes (except for LCZ 3, for which the values are highly dispersed). Among the natural classes, LCZ 101 (Dense Trees) and LCZ 107 (Water) had the lowest median LST, at 16.99 °C and 14.83 °C, respectively. However, an examination of classes LCZ 102 and LCZ 104 reveals that the difference from the coolest urban classes is limited to approximately 2 °C.
A similar pattern is observed in autumn, with a notable reduction in data variability. Once more, LCZ 8 is the warmest urban class, with a median LST of 32.83 °C. This is followed by the compact built-up classes, LCZ 2 (31.53 °C) and LCZ 3 (32.33 °C). The height and density of buildings appear to be significant factors, as evidenced by the 1 °C to 3 °C cooler temperatures observed in LCZ 5 and LCZ 6 compared to other urban LCZs. Regarding the natural classes, the coldest are Dense Trees (LCZ 101) and Water (LCZ 107), with a median LST of 25.99 °C and 26.78 °C, respectively. LCZ 102 (Scattered Trees) and LCZ 104 (Low Plants) show thermal behaviour similar to that of urban classes LCZ 5 and LCZ 6. With an LST of 29.69 °C and 31.68 °C, respectively, the difference from Open Mid- and Open Low-Rise classes is nearly negligible, with LCZ 104 being even slightly warmer.
The larger LST differences between LCZs are observed in summer. LCZ 101 and LCZ 107 are by far the coolest classes, with a median LST of 36.80 °C and 36.99 °C, respectively. These values are considerably lower than those observed in the other natural classes, namely Scattered Trees and Low Plants, which record median LST values of 42.20 °C and 44.46 °C, respectively. Significant discrepancies are observed between urban classes. The warmest classes are those with dense building structures and high imperviousness. LCZ 2 and LCZ 3 register 46.31 °C and 45.96 °C, respectively, and are followed by LCZ 8 with 45.79 °C. On the contrary, a reduction in building density and impervious land cover appears to result in a decrease in temperature. LCZ 5 and LCZ 6 are about 2 °C cooler than other urban classes. Once again, the difference from vegetated areas, LCZ 102 (Scattered Trees) and LCZ 104 (Low Plants), is subtle.
4.3. Air Temperature and LCZs
Seasonal temperatures were analysed separately for daytime and night-time conditions. The matrices in Figure 10 report differences in mean temperature between LCZ classes, with Cohen’s d values in parentheses. Notably, only six LCZ classes are present. This is because Netatmo weather stations were not situated within natural classes, but predominantly in urban areas. Specifically, there are 8 stations in LCZ 2, 9 in LCZ 3, 135 in LCZ 5, 42 in LCZ 6, 19 in LCZ 8, and 38 in LCZ 102, the only natural class represented.
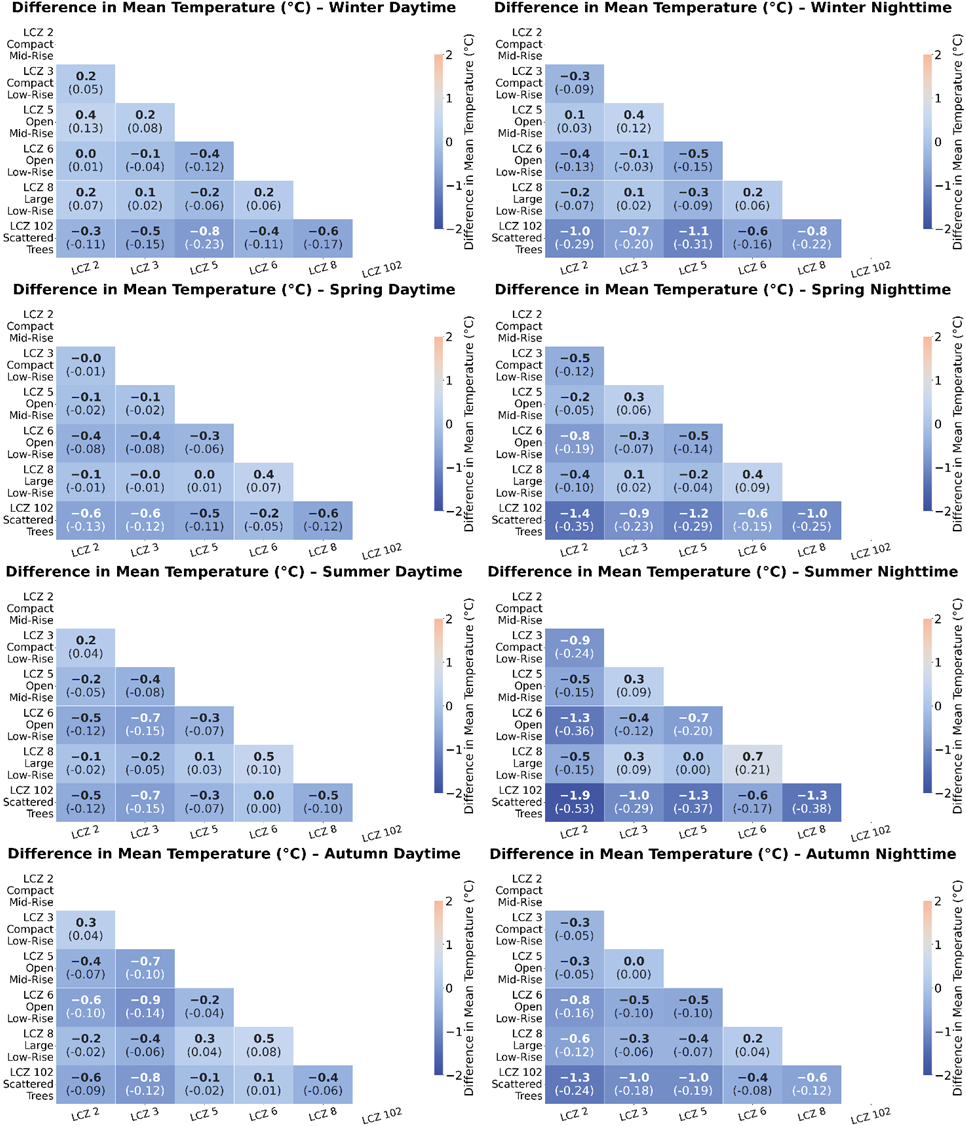
As expected, the greater variability among LCZs emerges at night. Nocturnal mean air temperature differences are higher than diurnal observations, and this pattern holds across all seasons. As in the LST analysis, winter is the season with the least inter-class variability. Mean air temperature values appear to be stable for all classes and the difference between daytime and night-time temperatures is minimal (around 11 °C during the day and 9 °C during the night). Only the natural class LCZ 102 (Scattered Trees) tends to be slightly cooler than other LCZs: the mean night-time temperature is around 1.0 °C lower than that observed in LCZ 2 (Compact Mid-Rise) and LCZ 5 (Open Mid-Rise).
On the other hand, greater variability is found in spring and autumn. Average day/night discrepancy is around 3 °C/4 °C and differences between LCZs are more significant, mostly at night. During spring nights, the natural class LCZ 102 has a median temperature of 12.80 °C, 1.40 °C and 1.10 °C cooler than LCZ 2 and LCZ 5, respectively. In addition, an urban class characterised by low-rise buildings and extended green areas such as LCZ 6 (Open Low-Rise) exhibits a mean night-time temperature (13.40 °C) that is 0.80 °C lower than city centres (LCZ 2, Compact Mid-Rise). During the daytime, the differences between LCZs narrow, but LCZ 102 experiences an average temperature half a degree lower than the other urban LCZs. A very similar pattern is observed in autumn. Temperatures are warmer on average than in spring, around 20.50 °C during the day and 18 °C during the night, and inter-class variability is more pronounced during nocturnal hours.
The most notable differences between LCZs occur in summer, when daytime temperatures are on average 5-6 °C higher than night-time temperatures. In addition, mean temperatures exhibit significant deviations depending on the LCZs. During daytime hours, areas with a high density of medium- and low-rise buildings (LCZ 2 and LCZ 3) and industrial areas (LCZ 8) experience an average air temperature above 28 °C (28.30 °C, 28.40 °C and 28.10 °C, respectively). The impact of reduced building density and increased green areas determines a decline of 0.40 °C for LCZ 5 (27.90 °C) and 0.70 °C (27.60 °C) for LCZ 6, in comparison with LCZ 2. Despite the considerable vegetated areas, LCZ 102 (Scattered Trees) does not show a marked cooling effect, with a median air temperature of 27.70 °C, comparable to that of the other urbanised LCZs. These findings support the results of the LST analysis, which indicated that, except for LCZ 101 (Dense Trees) and LCZ 107 (Water), the mitigation effect of other natural classes, namely LCZ 102 (Scattered Trees) and LCZ 104 (Low Plants), is almost negligible.
By contrast, during night-time hours, the cooling effect is stronger where impervious cover, building density, and building height are lower. LCZ 2 (Compact Mid-Rise) is the warmest class by night, with a median air temperature of 24.20 °C. Lower building compactness appears to reduce temperature by 0.70 °C, as LCZ 5 (Open Mid-Rise) and LCZ 8 (Large Low-Rise) record a value of 23.50 °C. The height of the buildings also seems to have an effect, as LCZ 3 has a median temperature of 23.30 °C. In suburban residential areas with low-rise buildings and extensive vegetated zones (LCZ 6), the night-time median air temperature reaches 22.80 °C, which is, on average, 1.30 °C lower than that observed in city centres (LCZ 2), and more than 0.5 °C lower than in Open Mid-Rise areas. The cooling effect of LCZ 102 (Scattered Trees) is even more pronounced. With a median air temperature of 22.20 °C, this class is, on average, 1.30 °C cooler than large residential areas (LCZ 5) and almost 2 °C cooler than historical centres (LCZ 2) at night. Furthermore, this trend can be observed in all other seasons, as LCZ 102 and LCZ 6 are expected to be 1.5 °C/2 °C and 0.5 °C/1 °C cooler at night than the warmest class (often LCZ 2).
To further examine the relationship between night-time air temperature and the cooling effect of different LCZs, Figure 11 presents an additional relevant indicator. The percentages refer to the number of warm nights recorded for each LCZ class. The orange bars indicate the percentage of tropical nights, i.e., nights with a minimum temperature above 20 °C, a threshold considered relevant for human health (Correa et al. 2024). The red bars refer to the percentage of very warm nights, when the minimum temperature does not fall below 24 °C.
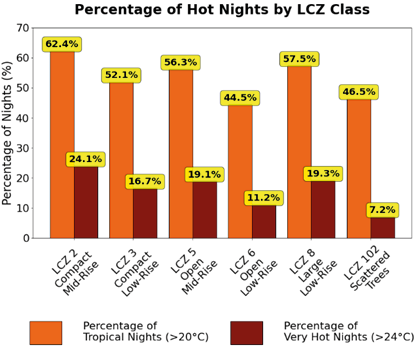
Looking at the results, some interesting conclusions can be drawn, confirming significant climatic differences across the LCZ classes. LCZ 2 (Compact Mid-Rise) exhibits the highest frequency of tropical nights. Indeed, on nearly two-thirds (62.4%) of the summer nights within this class, the minimum air temperature does not drop below 20 °C. LCZ 8 (Large Low-Rise) and LCZ 5 (Open Mid-Rise) have almost the same percentage of tropical nights, 57.5% and 56.3%, respectively, while LCZ 3 (Compact Low-Rise) has 52.1%. However, it is with LCZ 6 (44.5%) and LCZ 102 (46.5%) that the reduction in the percentage of tropical nights is particularly noteworthy, approximately 20 percentage points less than that observed in LCZ 2 and more than 10 percentage points less than that observed in LCZ 5. This indicates that residents of suburban neighbourhoods with open, low-rise buildings (LCZ 6, Open Low-Rise) and widespread vegetated areas and scattered trees (LCZ 102, Scattered Trees) experience a significantly reduced impact of tropical temperatures at night compared to those residing in historic centres (LCZ 2, Compact Mid-Rise) or highly populated residential areas with mid-rise buildings (LCZ 5, Open Mid-Rise).
A similar trend is observed regarding extreme minimum night-time temperatures. The highest percentage of nights with minimum temperatures above 24 °C is observed in LCZ 2, at 24.1%, while LCZ 5, LCZ 8, and LCZ 3 exhibit slightly lower values, at 19.1%, 19.3%, and 16.7%, respectively. In LCZ 6, the percentage declines to 11.2%, which is less than half of the very hot nights recorded in LCZ 2. In LCZ 102, the percentage is notably lower, with only 7.2% of nights exhibiting a minimum temperature above 24 °C.
5. Discussion
LCZs have emerged as a valuable tool for urban climate analysis and Urban Heat Island studies. By offering a climate-based classification, LCZs shed light on the thermal behaviour of different urban landscapes and provide a standardised system to monitor temperature dynamics in an urbanised context. This study marks the first systematic mapping of LCZs in the Florence-Prato-Pistoia Metropolitan Area.
By integrating satellite remote sensing and geospatial data on urban morphology and land cover with a supervised classification algorithm, the methodology adopted represents the state of the art in LCZ classification (Vavassori et al. 2024). The research achieved highly accurate LCZ maps, aligned with results from similar studies in other cities (Vavassori et al. 2023; Puche et al. 2023), although further improvements are always possible, in particular by adopting hyperspectral images, as in Vavassori et al. (2024).
The LCZ map highlights several differences in urbanisation patterns across the municipalities investigated in the present study. Notably, forests and water bodies (LCZ 101 and LCZ 107) are almost absent in the “Piana Fiorentina”. Instead, cultivated or uncultivated fields (LCZ 104) and areas with scattered trees (LCZ 102) are the predominant natural land cover, largely due to the intensive olive-tree cultivation in the region. In this context, urban LCZs exhibit considerable variability. Florence, the most urbanised municipality within the study area, is characterised by densely populated residential areas (LCZ 5, Open Mid-Rise) and a compact historical centre (LCZ 2, Compact Mid-Rise). These zones, characterised by taller buildings, are often warmer than other urban classes. In contrast, in other municipalities, low-rise buildings interspersed with public green spaces or individual villas surrounded by private gardens (LCZ 6, Open Low-Rise) are generally the main typology of residential areas.
However, the most widespread urban class in the “Piana Fiorentina” is LCZ 8 (Large Low-Rise), representing industrial zones characterised by warehouses, high imperviousness, and minimal vegetation. The large share of LCZ 8 underscores the intense industrialisation of the area and aligns with findings from the SNPA report “Consumo di suolo, dinamiche territoriali e servizi ecosistemici” (2020), which highlights industrial expansion as the major contributor to soil consumption in the region. The intense urbanisation of the region entails non-negligible effects not only in terms of land consumption and hydrogeological stability, but also with regard to urban climate dynamics and the UHI phenomenon. In this regard, the study conducted by Guerri et al. (2023) within the joint programme MIRIFICUS (Monitoraggio degli Interventi di RIForestazione per l’Isola di Calore Urbana tramite i Satelliti) targets LCZ 8 in Florence. They simulated tree-based mitigation strategies in the industrial area of the agri-food market, identified as a significant hot spot of heat stress (Guerri et al. 2022), and demonstrated the effective cooling capacity of NBS in this particular urban area.
In terms of map accuracy, the OA is comparable to that of other LCZ maps produced with the same methodology. Puche et al. (2023) achieved an OA score of 94% for their LCZ map of the Metropolitan Area of Milan, while the LCZ map for Zurich produced by Vavassori et al. (2023) records an OA of 95.50%. Furthermore, the possibility of using the LCZ classification has taken the UHI analysis beyond the urban-rural dichotomy and enabled the analysis of variations within urban and peri-urban environments in the study area.
The integration of LST data from Landsat 8 and crowdsourced air temperature data from CWS provided complementary insights into the UHI effect.
The LST analysis revealed distinct thermal behaviours across LCZ classes, emphasising the influence of urban morphology and land cover. This study also identified strong seasonal variability in LST patterns, with the largest differences between LCZs occurring during summer. Dense Trees (LCZ 101) and Water (LCZ 107) consistently showed the lowest LST values, often 8-10 °C cooler than urban zones, whereas other vegetated classes, such as Scattered Trees (LCZ 102) and Low Plants (LCZ 104), offered only limited cooling effects, with LST values only slightly lower than those of urban zones, suggesting that green areas covered by grass or few trees have a negligible impact on the mitigation of rising temperature and the UHI effect. This is critical for the “Piana Fiorentina”, where these latter two classes dominate natural areas, highlighting the need for more effective cooling landscapes such as forests and water bodies. Recent studies (Yang et al. 2024) suggest that rural areas within a 10-15 km radius of cities can mitigate UHI by reducing urban temperatures by up to 0.50 °C. Expanding tree cover and introducing water bodies in the rural-urban fringe could enhance this cooling effect for Florence and its surroundings.
Air temperature analysis complemented the LST results, adding new insights to the understanding of UHI dynamics. Because weather-station observations are recorded continuously over time from weather stations, it was possible to conduct the analysis considering different times of day, overcoming the limitation of LST data, which are constrained to the time of satellite acquisition (around noon, for central Italy). The study represents the first attempt to use CWS data for climate studies in this area.
Air temperature data revealed significant day-night variations. During the daytime, differences between urban LCZs were less pronounced. During summer, median temperatures range from 28.30 °C in LCZ 2 (Compact Mid-Rise) to 27.60 °C in LCZ 6 (Open Low-Rise). However, the natural class Scattered Trees (LCZ 102) showed similar values (27.70 °C), confirming the LST findings that this class provides limited cooling benefits.
However, night-time cooling effects were much more evident in greener, less urbanised zones. LCZ 102 recorded night-time temperatures around 22.20 °C, about 2 °C cooler than the historical city centre (LCZ 2), and 1.30 °C cooler than densely populated residential neighbourhoods (LCZ 5). Residential areas with low-rise buildings and greenery (LCZ 6) also experienced significant night-time cooling, with median temperatures dropping to 22.80 °C. Although the difference may appear insignificant, two degrees less in air temperature is comparable to the reduction that would be experienced when ascending to an altitude exceeding 300 metres, according to the global average lapse rate (LR) of -6.0 °C/km (Kattel et al. 2013; Wang et al. 2018).
This cooling effect was particularly relevant when considering tropical nights, defined by minimum temperatures above 20 °C. This phenomenon is becoming increasingly frequent in the Florence area (Consorzio LaMMA), but it is shown to be very sensitive to the spatial characteristics of the urban environment. In their study exploiting 25 weather stations in Florence, Petralli et al. (2011) discovered evident intra-urban differences. The hottest cluster of stations recorded 42 tropical nights in the summer months for the years 2005-2008, while the coolest cluster recorded only 10. Our results corroborate these findings, adding new insights also thanks to the LCZ classification. We found that residents in greener LCZs (e.g., LCZ 6 and LCZ 102) experienced fewer tropical nights than those in urban zones such as LCZ 2 and LCZ 5. Moreover, extremely high night-time temperatures (>24 °C) occurred twice as often in LCZ 2 as in LCZ 5 and three times as often as in LCZ 102, underscoring the role of vegetation and lower building density in mitigating heat stress during nocturnal hours.
6. Conclusion
This study provides a comprehensive analysis of urban climate dynamics within the Metropolitan Area of Florence-Prato-Pistoia, focusing on the Urban Heat Island (UHI) phenomenon through the lens of LCZs, LST, and air-temperature data. The work represents the first systematic mapping of LCZs in the area and offers valuable insights into the interactions between urban morphology and thermal behaviour.
By integrating LST and air-temperature data, the study contributed to the thermal characterisation of LCZs and allowed a quantitative analysis of temperature dynamics in the study area. This offers an in-depth understanding of the spatial and temporal variability of urban climate.
The LST analysis revealed significant differences in thermal response across LCZs, with pronounced seasonal variability, highlighting the critical role of urban morphology and land cover in shaping surface-temperature patterns.
Furthermore, integrating a spatially distributed network of CWS effectively addressed the scarcity of official monitoring stations. This enabled the collection of spatially distributed air-temperature data, overcoming the limitations of satellite-based LST and allowed a much more temporally detailed analysis of temperature dynamics within different LCZs. Notably, the analysis of tropical nights revealed a significant difference in nocturnal heat exposure between compact, densely built LCZs and greener, more open urban zones.
The present approach may thus represent a solid foundation for policymakers and may therefore provide practical guidance for urban planning. Indeed, combining quantitative surface- and air-temperature data with the standardised LCZ classification aids in identifying priority areas for heat-mitigation strategies across the metropolitan area. In fact, while microclimatic simulations, as in Romano et al. (2020), Romano et al. (2022), Guerri et al. (2023), and Banti et al. (2025), are invaluable for assessing thermal variation under different mitigation scenarios at a very fine scale, they are typically restricted to specific sites of limited extent (buildings, squares, small districts, etc.). Moreover, hotspot analyses such as those in Guerri et al. (2021) effectively pinpoint localised thermal extremes, even though they only use LST, but they lack the broader interpretative framework provided here by the adoption of the standardised LCZ classification. Here, our results complement these other approaches.
Combined with quantitative temperature data, the LCZ framework goes beyond the simple urban classification and offers local authorities a comprehensive overview of urban climate dynamics in the “Piana Fiorentina”, supporting mitigation strategies and helping prioritise interventions and optimise resources more efficiently. For example, the municipality of Florence has recently adopted a new “Piano del Verde e degli Spazi Aperti”, which aims to address climate risks through large-scale measures (e.g., 50,000 trees and shrubs; 20 new urban green spaces) and small-scale actions (pocket parks, tiny forests, community gardens), inspired by the 3-30-300 rule. Similarly, Prato has launched an ambitious project of urban greening and reforestation. Given the scale and the amount of investment, as well as the long time required for NBS to become effective, prioritisation is essential, and our findings can inform where and how to intervene first, avoiding targeting areas less subject to extreme temperatures or leaving the most vulnerable areas unaddressed.
Besides, compact urban areas (LCZ 2), typical of historical city centres, emerged as highly sensitive, especially at night, with the greatest frequency of tropical nights. However, the high density of buildings in these zones can prevent authorities from adopting urban-planning mitigation strategies, such as those inspired by the 3-30-300 rule. As observed by Romano et al. (2022), these areas are also subject to historical and landscape constraints that can limit retrofit strategies or urban greening. The risk is to leave these highly vulnerable areas unaddressed if proper strategies are not adopted. For example, Evola et al. (2017) suggested that, for old compact neighbourhoods, it is preferable to intervene on roofing and/or paving materials, which can improve outdoor thermal comfort. In this regard, the analysis conducted by Romano et al. (2022) in “Largo Annigoni” square, in the city centre of Florence, illustrated how strategic public-space design can mitigate heat in heritage contexts.
Beyond city centres, residential neighbourhoods and industrial districts also warrant attention. As our analysis demonstrated, LCZ 5 and LCZ 8 are critical in terms of both LST and air temperature, particularly at night. Moreover, these classes represent a dominant share in the urban fabric of the “Piana Fiorentina”. Given their more open building patterns and available space, these zones are well suited to urban-greening interventions, which can be deployed effectively at scale. In this regard, the ongoing European LIFE - ESCAPOS (Environment Energy for Strategic CApillary Urban POlicieS) project (European Commission, n.d.) is a forward-looking example because it is testing mitigation strategies based on NBS in “Firenze Nova”, a highly sensitive area characterised by open mid-rise residential buildings (LCZ 5) and factories (LCZ 8).
In conclusion, several improvements and extensions to this work can be pursued. Future studies should address the incorporation of hyperspectral satellite imagery to enhance LCZ classification accuracy, especially for urban zones with complex land-use patterns. Additionally, advanced machine-learning techniques could integrate CWS data with auxiliary variables for high-resolution modelling of urban air temperatures. Such developments would provide actionable insights for mitigating UHI effects and improving urban liveability, particularly in the face of increasing climate variability.
References
Aslam, A., Rana, I. A. (2022). The use of local climate zones in the urban environment: A systematic review of data sources, methods, and themes. Urban Climate, 42, 101120. DOI: https://doi.org/10.1016/j.uclim.2022.101120
Balchin, W. G. V., Pye, N. (1947). A micro‐climatological investigation of bath and the surrounding district. Quarterly Journal of the Royal Meteorological Society, 73 (317-318), 297-323. DOI: https://doi.org/10.1002/qj.49707331706
Banti, N., Ciacci, C., Bazzocchi, F., Di Naso, V. (2025). Potential Heat Island Phenomenon in Florence: Microclimatic Assessment Through Digital Urban Modelling. In He, B., Piselli, C., Karunathilake, H., Cheshmehzangi, A., Attia, S., Darko, A. (Eds.). Towards the Framework of Livable and Resilient Cities. Cham, Springer. DOI: https://doi.org/10.1007/978-3-031-97849-4_24
Bell, S., Cornford, D., Bastin, L. (2015). How good are citizen weather stations? Addressing a biased opinion. Weather, 70 (3), 75-84. DOI: https://doi.org/10.1002/wea.2316
Breiman, L. (2001). Random Forests. Machine Learning, 45, 5-32. DOI: https://doi.org/10.1023/A:1010933404324
Cai, M., Ren, C., Xu, Y., Lau, K. K.-L., Wang, R. (2018). Investigating the relationship between local climate zone and land surface temperature using an improved WUDAPT methodology – A case study of Yangtze River Delta, China. Urban Climate, 24, 485-502. DOI: https://doi.org/10.1016/j.uclim.2017.05.010
Chapman, S., Thatcher, M., Salazar, A., Watson, J. E. M., McAlpine, C. A. (2019). The impact of climate change and urban growth on urban climate and heat stress in a subtropical city. International Journal of Climatology, 39, 3013-3030. DOI: https://doi.org/10.1002/joc.5998
Cohen, J. (1977). Statistical Power Analysis for the Behavioral Sciences. New York, Routledge. DOI: https://doi.org/10.4324/9780203771587
Consorzio LaMMA (n.d.). Il meteo in Toscana. https://www.lamma.toscana.it/
Copernicus Browser. (n.d.). Copernicus Browser. https://browser.dataspace.copernicus.eu/
Copernicus Land Monitoring Services. (n.d.). CLMS Portfolio. https://land.copernicus.eu/en/products
Correa, J., Dorta, P., López-Díez, A., Díaz-Pacheco, J. (2024). Analysis of tropical nights in Spain (1970-2023): Minimum temperatures as an indicator of climate change. International Journal of Climatology, 44 (9), 3006-3027. DOI: https://doi.org/10.1002/joc.8510
Creutzig, F., Agoston, P., Minx, J. C., Canadell, J. G., Andrew, R. M., Le Quéré, C., Peters, G. P., Sharifi, A., Yamagata, Y., Dhakal, S. (2016). Urban infrastructure choices structure climate solutions. Nature Climate Change, 6, 1054-1056. DOI: https://doi.org/10.1038/nclimate3169
Demuzere, M., Kittner, J., Bechtel, B. (2021). The LCZ Generator: A Web Application to Create Local Climate Zone Maps. Frontiers in Environmental Science, 9. DOI: https://doi.org/10.3389/fenvs.2021.637455
ENVI-met. (n.d.). The Future of Sustainable Urban Planning with Climate Adaptation. https://envi-met.com/
European Commission. (n.d.). LIFE 3.0. https://webgate.ec.europa.eu/life/publicWebsite/project/LIFE23-CCA-IT-LIFE-ESCAPOS-101157553/environment-energy-for-strategic-capillary-urban-policies
Evola, G., Gagliano, A., Fichera, A., Marletta, L., Martinico, F., Nocera, F., Pagano, A. (2017). UHI effects and strategies to improve outdoor thermal comfort in dense and old neighbourhoods. Energy Procedia, 134, 692-701. DOI: https://doi.org/10.1016/j.egypro.2017.09.589
Feichtinger, M., de Wit, R., Goldenits, G., Kolejka, T., Hollósi, B., Žuvela-Aloise, M., Feigl, J. (2020). Case-study of neighborhood-scale summertime urban air temperature for the City of Vienna using crowd-sourced data. Urban Climate, 32, 100597. DOI: https://doi.org/10.1016/j.uclim.2020.100597
Fenner, D., Bechtel, B., Demuzere, M., Kittner, J., Meier, F. (2021). CrowdQC+―A Quality-Control for Crowdsourced Air-Temperature Observations Enabling World-Wide Urban Climate Applications. Frontiers in Environmental Science, 9. DOI: https://doi.org/10.3389/fenvs.2021.720747
Geletič, J., Lehnert, M., Dobrovolný, P. (2016). Land Surface Temperature Differences within Local Climate Zones, Based on Two Central European Cities. Remote Sensing, 8 (10), 788. DOI: https://doi.org/10.3390/rs8100788
GEOscopio - Regione Toscana. (n.d.). Geoscopio. https://www.regione.toscana.it/-/geoscopio
Good, E. J. (2016). An in situ-based analysis of the relationship between land surface “skin” and screen-level air temperatures. Journal of Geophysical Research: Atmospheres, 121 (15), 8801-8819. DOI: https://doi.org/10.1002/2016JD025318
Guerri, G., Crisci, A., Congedo, L., Munafò, M., Morabito, M. (2022). A functional seasonal thermal hot-spot classification: Focus on industrial sites. Science of The Total Environment, 806 (4), 151383. DOI: https://doi.org/10.1016/j.scitotenv.2021.151383
Guerri, G., Crisci, A., Messeri, A., Congedo, L., Munafò, M., Morabito, M. (2021). Thermal Summer Diurnal Hot-Spot Analysis: The Role of Local Urban Features Layers. Remote Sensing, 13 (3), 538. DOI: https://doi.org/10.3390/rs13030538
Guerri, G., Crisci, A., Morabito, M. (2023). Urban microclimate simulations based on GIS data to mitigate thermal hot-spots: Tree design scenarios in an industrial area of Florence. Building and Environment, 245, 110854. DOI: https://doi.org/10.1016/j.buildenv.2023.110854
Gurney, K. R., Romero-Lankao, P., Seto, K. C., Hutyra, L. R., Duren, R., Kennedy, C., Grimm, N. B., Ehleringer, J. R., Marcotullio, P., Hughes, S., Pincetl, S., Chester, M. V., Runfola, D. M., Feddema, J. J., Sperling, J. (2015). Climate change: Track urban emissions on a human scale. Nature, 525, 179-181. DOI: https://doi.org/10.1038/525179a
Hassani, A., Santos, G. S., Schneider, P., Castell, N. (2023). Interpolation, Satellite-Based Machine Learning, or Meteorological Simulation? A Comparison Analysis for Spatio-temporal Mapping of Mesoscale Urban Air Temperature. Environmental Modeling & Assessment, 29, 291-306. DOI: https://doi.org/10.1007/s10666-023-09943-9
Ho, H. C., Knudby, A., Xu, Y., Hodul, M., Aminipouri, M. (2016). A comparison of urban heat islands mapped using skin temperature, air temperature, and apparent temperature (Humidex), for the greater Vancouver area. Science of the Total Environment, 544, 929-938. DOI: https://doi.org/10.1016/j.scitotenv.2015.12.021
Huang, F., Jiang, S., Zhan, W., Bechtel, B., Liu, Z., Demuzere, M., Huang, Y., Xu, Y., Ma, L., Xia, W., Quan, J., Jiang, L., Lai, J., Wang, C., Kong, F., Du, H., Miao, S., Chen, Y., Chen, J. (2023). Mapping local climate zones for cities: A large review. Remote Sensing of Environment, 292, 113573. DOI: https://doi.org/10.1016/j.rse.2023.113573
Istat. (2024). Resident population by age, sex and marital status on January 1st. https://demo.istat.it/app/?i=POS&l=en
Kattel, D. B., Yao, T., Yang, K., Tian, L., Yang, G., Joswiak, D. (2013). Temperature lapse rate in complex mountain terrain on the southern slope of the central Himalayas. Theoretical and Applied Climatology, 113, 671-682. DOI: https://doi.org/10.1007/s00704-012-0816-6
Konijnendijk, C. C. (2023). Evidence-based guidelines for greener, healthier, more resilient neighbourhoods: Introducing the 3-30-300 rule. Journal of Forestry Research, 34, 821-830. DOI: https://doi.org/10.1007/s11676-022-01523-z
Kotharkar, R., Ghosh, A., Kapoor, S., Reddy, D. G. K. (2022). Approach to local climate zone based energy consumption assessment in an Indian city. Energy and Buildings, 259, 111835. DOI: https://doi.org/10.1016/j.enbuild.2022.111835
Lang, N., Jetz, W., Schindler, K., Wegner, J. D. (2023). A high-resolution canopy height model of the Earth. Nature Ecology & Evolution, 7, 1778-1789. DOI: https://doi.org/10.1038/s41559-023-02206-6
Meier, F., Fenner, D., Grassmann, T., Otto, M., Scherer, D. (2017). Crowdsourcing air temperature from citizen weather stations for urban climate research. Urban Climate, 19, 170-191. DOI: https://doi.org/10.1016/j.uclim.2017.01.006
Morabito, M., Crisci, A., Guerri, G., Messeri, A., Congedo, L., Munafò, M. (2021). Surface urban heat islands in Italian metropolitan cities: Tree cover and impervious surface influences. Science of The Total Environment, 751, 142334. DOI: https://doi.org/10.1016/j.scitotenv.2020.142334
Muller, C. L., Chapman, L., Johnston, S., Kidd, C., Illingworth, S., Foody, G., Overeem, A., Leigh, R. R. (2015). Crowdsourcing for climate and atmospheric sciences: current status and future potential. International Journal of Climatology, 35 (11), 3185-3203. DOI: https://doi.org/10.1002/joc.4210
Napoly, A., Grassmann, T., Meier, F., Fenner, D. (2018). Development and Application of a Statistically-Based Quality Control for Crowdsourced Air Temperature Data. Frontiers in Earth Science, 6. DOI: https://doi.org/10.3389/feart.2018.00118
Oke, T. R., Mills, G., Christen, A., Voogt, J. A. (2017). Urban Climates. Cambridge, Cambridge University Press. DOI: https://doi.org/10.1017/9781139016476
Oxoli, D., Cedeno Jimenez, J. R., Capizzi, E., Brovelli, M. A., Siciliani de Cumis, M., Sacco, P., Tapete, D. (2023). QGIS and Open Data Cube Applications for Local Climate Zones Analysis Leveraging PRISMA Hyperspectral Satellite Data. The International Archives of the Photogrammetry, Remote Sensing and Spatial Information Sciences, XLVIII-1/W2-2023, 111-116. DOI: https://doi.org/10.5194/isprs-archives-XLVIII-1-W2-2023-111-2023
Petralli, M., Massetti, L., Orlandini, S. (2011). Five years of thermal intra-urban monitoring in Florence (Italy) and application of climatological indices. Theoretical and Applied Climatology, 104, 349-356. DOI: https://doi.org/10.1007/s00704-010-0349-9
Puche, M., Vavassori, A., Brovelli, M. A. (2023). Insights into the Effect of Urban Morphology and Land Cover on Land Surface and Air Temperatures in the Metropolitan City of Milan (Italy) Using Satellite Imagery and In Situ Measurements. Remote Sensing, 15 (3), 733. DOI: https://doi.org/10.3390/rs15030733
Romano, R., Bologna, R., Hasanaj, G., Arnetoli, M. V. (2020). Adaptive Design to Mitigate the Effects of UHI: The Case Study of Piazza Togliatti in the Municipality of Scandicci. In Littlewood, J., Howlett, R., Capozzoli, A., Jain, L. (Eds.). Sustainability in Energy and Buildings. Smart Innovation, Systems and Technologies, 163, Singapore, Springer. DOI: https://doi.org/10.1007/978-981-32-9868-2_45
Romano, R., Gallo, P., Donato, A. (2022). Evaluation of Mitigation Strategies of The Urban Heat Island Effect in Mediterranean Area. The Case Study of Largo Annigoni in Florence (Italy). In Alberti, F., Amer, M., Mahgoub, Y., Gallo, P., Galderisi, A., Strauss, E. (Eds.). Urban and Transit Planning. Advances in Science, Technology & Innovation, Cham, Springer. DOI: https://doi.org/10.1007/978-3-030-97046-8_6
Rubel, F., Kottek, M. (2010). Observed and projected climate shifts 1901-2100 depicted by world maps of the Köppen-Geiger climate classification. Meteorologische Zeitschrift, 19 (2), 135-141. DOI: https://doi.org/10.1127/0941-2948/2010/0430
SNPA (2020). Consumo di suolo, dinamiche territoriali e servizi ecosistemici. Edizione 2020. https://www.snpambiente.it/pubblicazioni/report-snpa/consumo-di-suolo-dinamiche-territoriali-e-servizi-ecosistemici-edizione-2020/
Stewart, I. D., Oke, T. R. (2012). Local Climate Zones for Urban Temperature Studies. Bulletin of the American Meteorological Society, 1879-1900. DOI: https://doi.org/10.1175/BAMS-D-11-00019.1
Unal Cilek, M., Cilek, A. (2021). Analyses of land surface temperature (LST) variability among local climate zones (LCZs) comparing Landsat-8 and ENVI-met model data. Sustainable Cities and Society, 69, 102877. DOI: https://doi.org/10.1016/j.scs.2021.102877
United Nations Global Compact. (2019). The Nature-Based Solutions for Climate Manifesto. https://d306pr3pise04h.cloudfront.net/docs/publications%2FNature-Based-Solutions-for-Climate-Manifesto.pdf
Vasić, M., Dunjić, J., Savić, S., Dočkal, O. (2025). Applications of local climate zone classification in European cities: A review of in situ and mobile monitoring methods in urban climate studies. Open Geosciences, 17, 20250878. DOI: https://doi.org/10.1515/geo-2025-0878
Vavassori, A., Giuliani, G., Brovelli, M. A. (2023). Mapping Local Climate Zones in Lausanne (Switzerland) with Sentinel-2 and PRISMA Imagery: comparison of classification performance using different band combinations and building height data. International Journal of Digital Earth, 16, 4790-4810. DOI: https://doi.org/10.1080/17538947.2023.2283485
Vavassori, A., Oxoli, D., Venuti, G., Brovelli, M. A., Siciliani de Cumis, M., Sacco, P., Tapete, D. (2024). A combined Remote Sensing and GIS-based method for Local Climate Zone mapping using PRISMA and Sentinel-2 imagery. International Journal of Applied Earth Observation and Geoinformation, 131, 103944. DOI: https://doi.org/10.1016/j.jag.2024.103944
Venter, Z. S., Brousse, O., Esau, I., Meier, F. (2020). Hyperlocal mapping of urban air temperature using remote sensing and crowdsourced weather data. Remote Sensing of Environment, 242, 111791. DOI: https://doi.org/10.1016/j.rse.2020.111791
Verdonck, M.-L., Demuzere, M., Hooyberghs, H., Beck, C., Cyrys, J., Schneider, A., Dewulf, R., Van Coillie, F. (2018). The potential of local climate zones maps as a heat stress assessment tool, supported by simulated air temperature data. Landscape and Urban Planning, 178, 183-197. DOI: https://doi.org/10.1016/j.landurbplan.2018.06.004
Voogt, J. A., Oke, T. R. (2003). Thermal remote sensing of urban climates. Remote Sensing of Environment, 86 (3), 370-384. DOI: https://doi.org/10.1016/S0034-4257(03)00079-8
Wang, Y., Wang, L., Li, X., Chen, D. (2018). Temporal and spatial changes in estimated near-surface air temperature lapse rates on Tibetan Plateau. International Journal of Climatology, 38 (7), 2907-2921. DOI: https://doi.org/10.1002/joc.5471
Yang, M., Ren, C., Wang, H., Wang, J., Feng, Z., Kumar, P., Haghighat, F., Cao, S.- J. (2024). Mitigating urban heat island through neighboring rural land cover. Nature Cities, 1, 522-532. DOI: https://doi.org/10.1038/s44284-024-00091-z
Zumwald, M., Knüsel, B., Bresch, D. N., Knutti, R. (2021). Mapping urban temperature using crowd-sensing data and machine learning. Urban Climate, 35, 100739. DOI: https://doi.org/10.1016/j.uclim.2020.100739